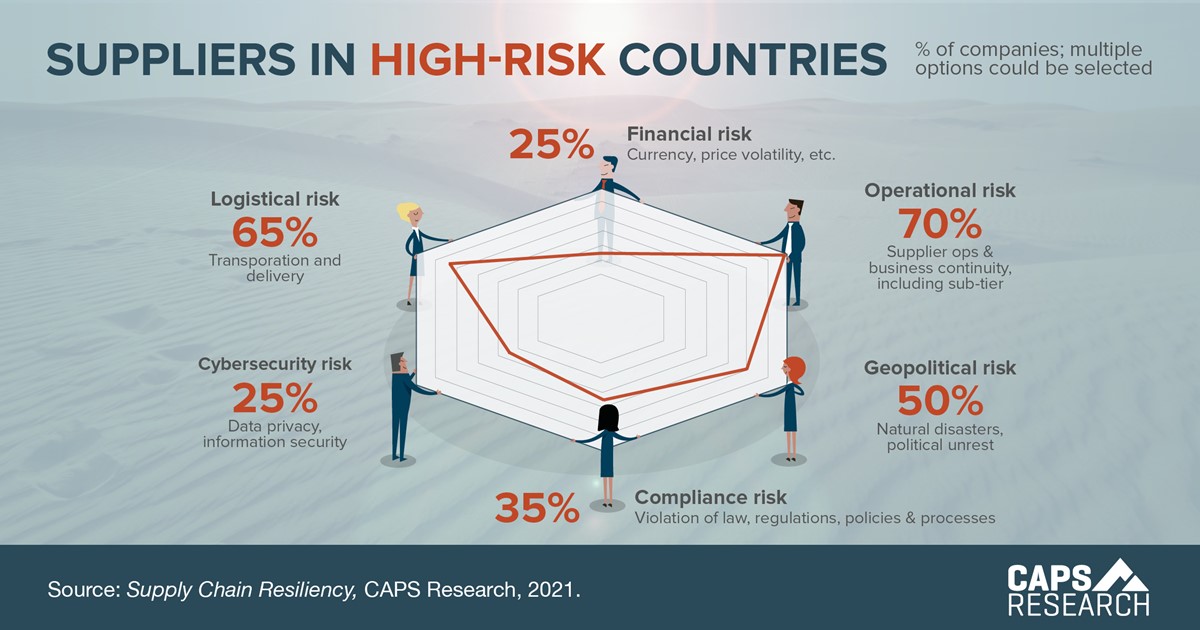
Within the next 18 months, 49% of companies plan to shift supply away from high-risk countries to strategically adapt to supply chain disruptions. Companies say the top risks driving the move are operational (70% of companies), logistical (65%), and geopolitical (50%).
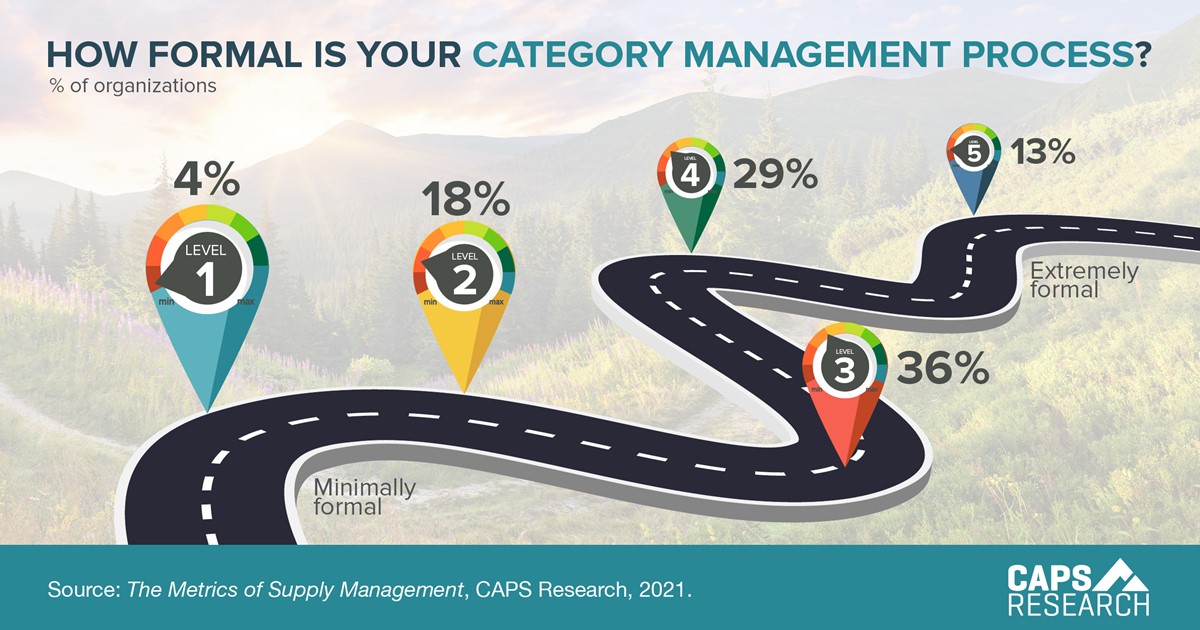
Category Management Process
More than a third of the procurement executives we surveyed (36%) ranked their category management process as moderately formal, while 13% said their program was extremely formal.
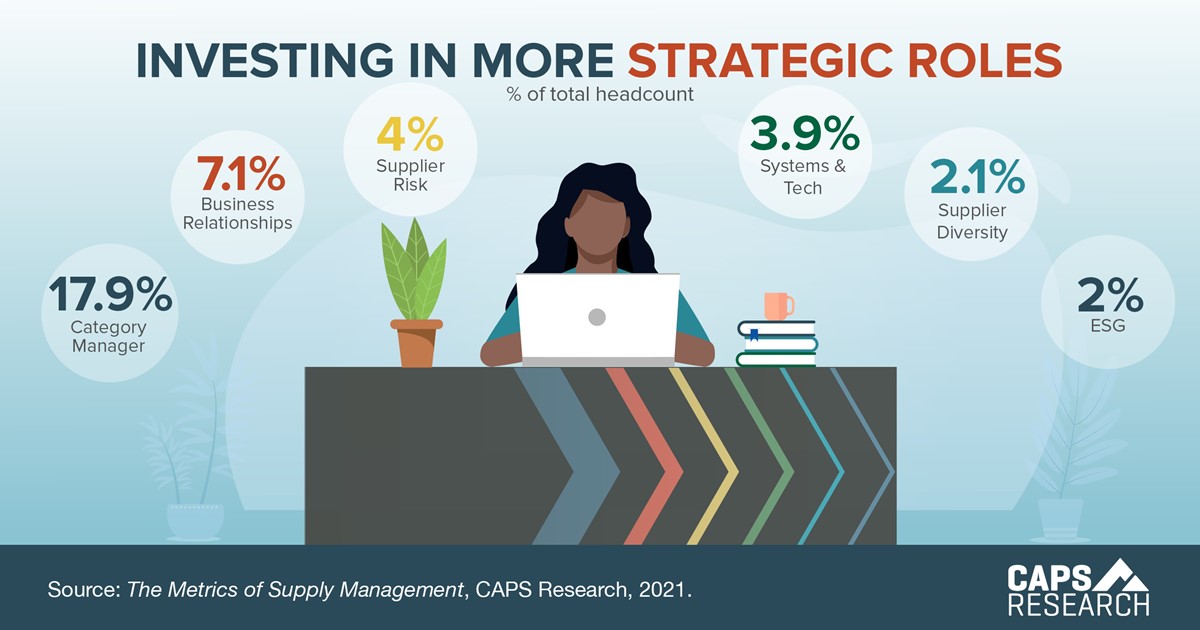
Investing in More Strategic Roles
In a 2018 CAPS report, 40% of CPOs chose strategic thinking as the most important capability to advance the profession strategically. Will alignment to larger business objectives going forward require greater headcount working on strategic initiatives?
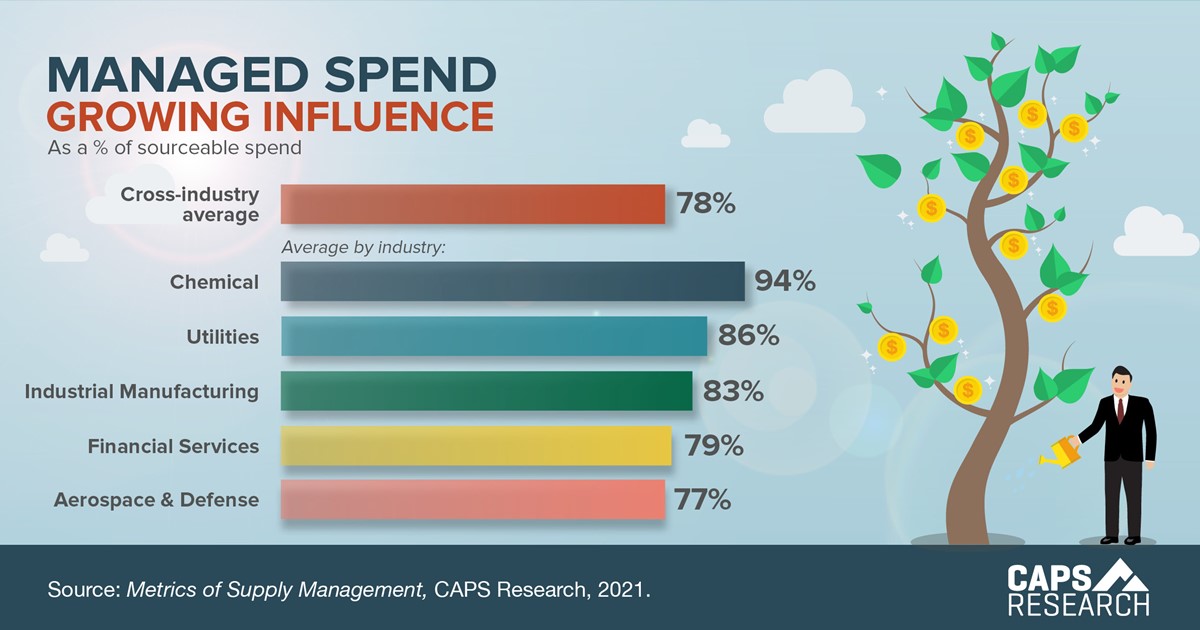
Managed Spend Growing Influence
When the business involves the supply management group in purchasing and sourcing, it can increase savings, better leverage organizational spend, and negotiate stronger contracts. Managed spend, as a percentage of sourceable spend, is a primary indicator of a company’s ability to capture value from the supply management process.
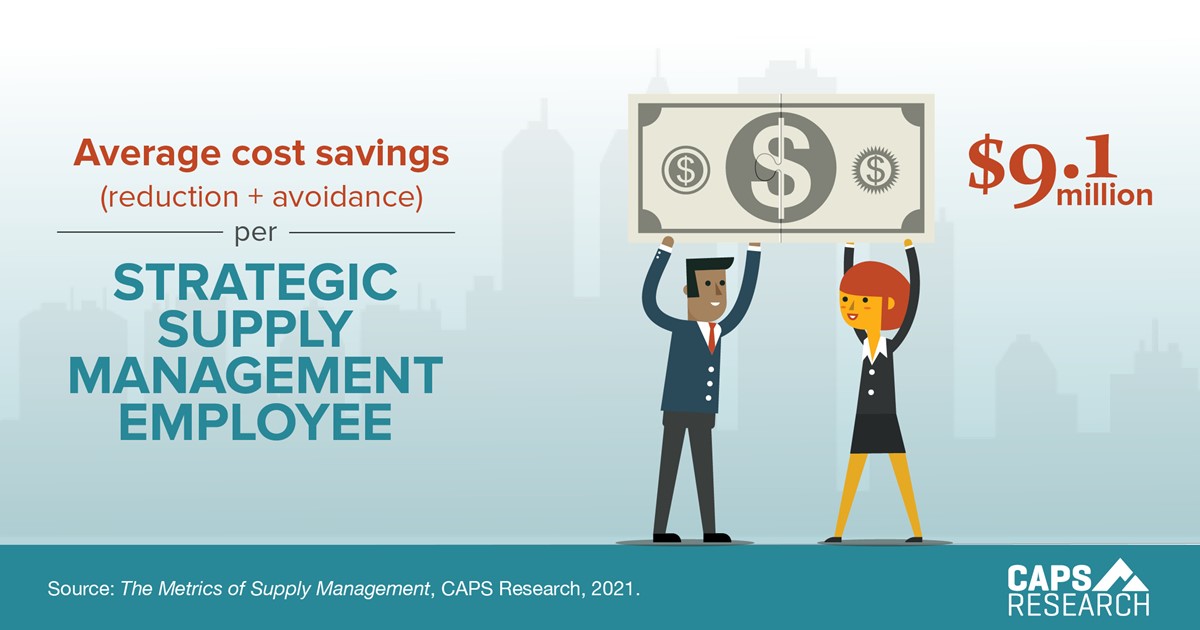
Average Cost Savings
Cost savings is a powerful KPI for demonstrating the value of supply management (SM) to the business. On average, 21.8% of SM employees are in a strategic sourcing role, each delivering $9.1 million in total savings. How does your company compare?
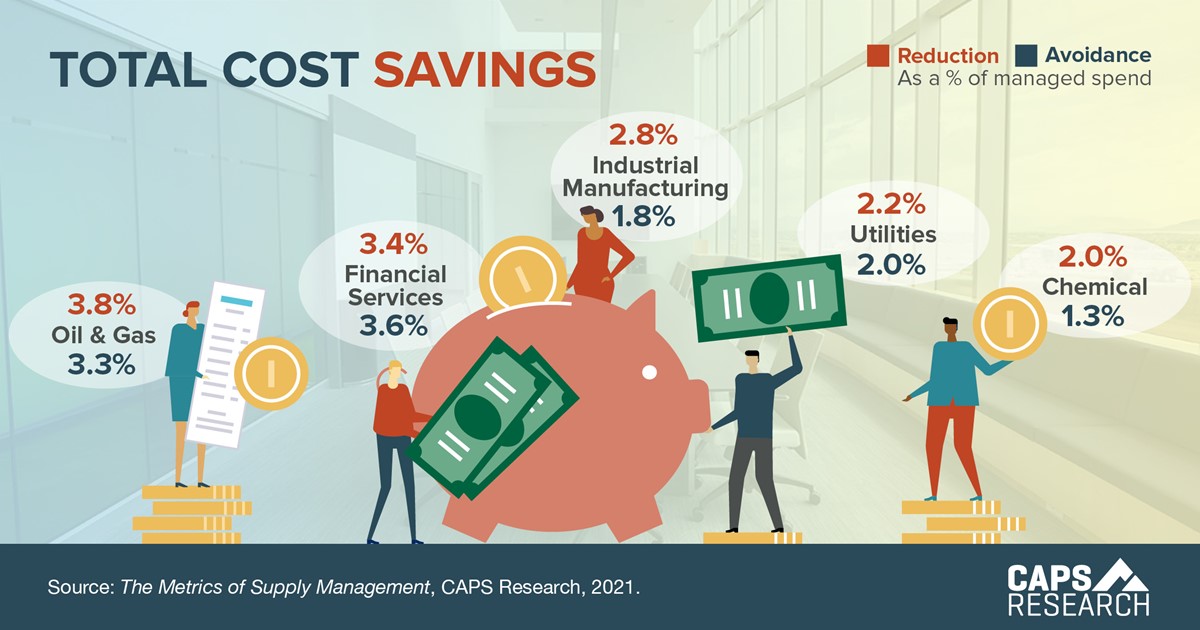
Total Cost Savings
Cost savings is a cornerstone KPI for most supply management groups, measured here as reduction and avoidance in managed spend. In 2021, Oil and Gas led with 7.1% total cost savings.
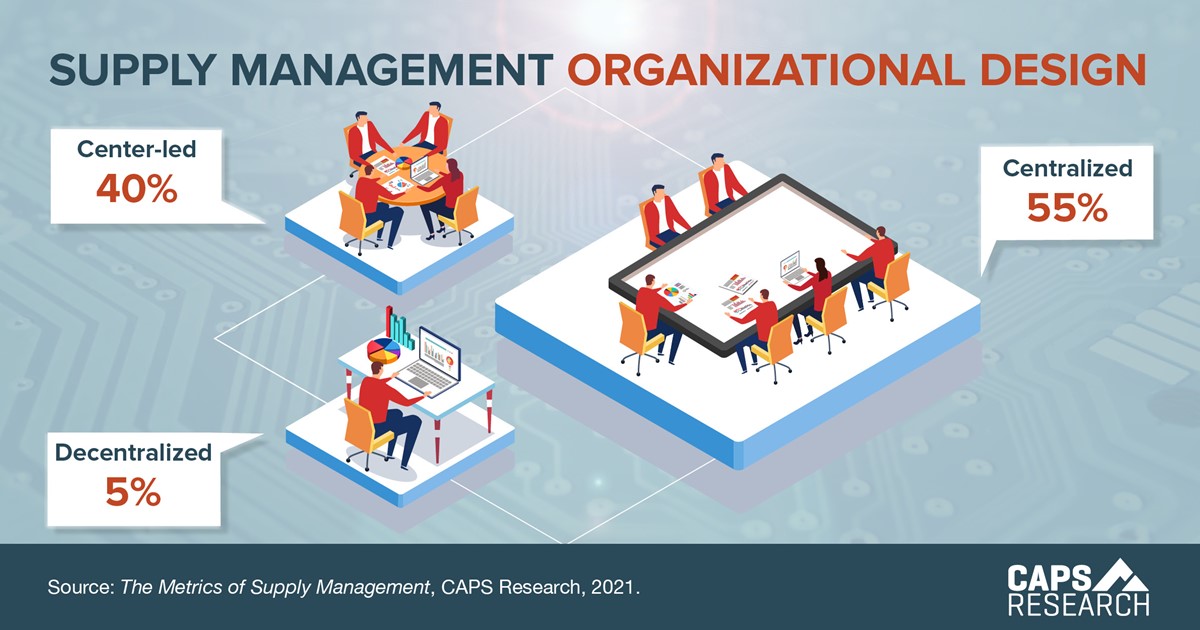
Supply Management Org Design
Companies that undergo organization structure changes as part of an enterprise-wide initiative or market-driven decision face a huge endeavor, but data indicates these changes don’t happen frequently. For the last three years, an average of 72% of companies say they’ve operated under their current org structure for five or more years (Metrics of Supply Management, 2019 - 2021).
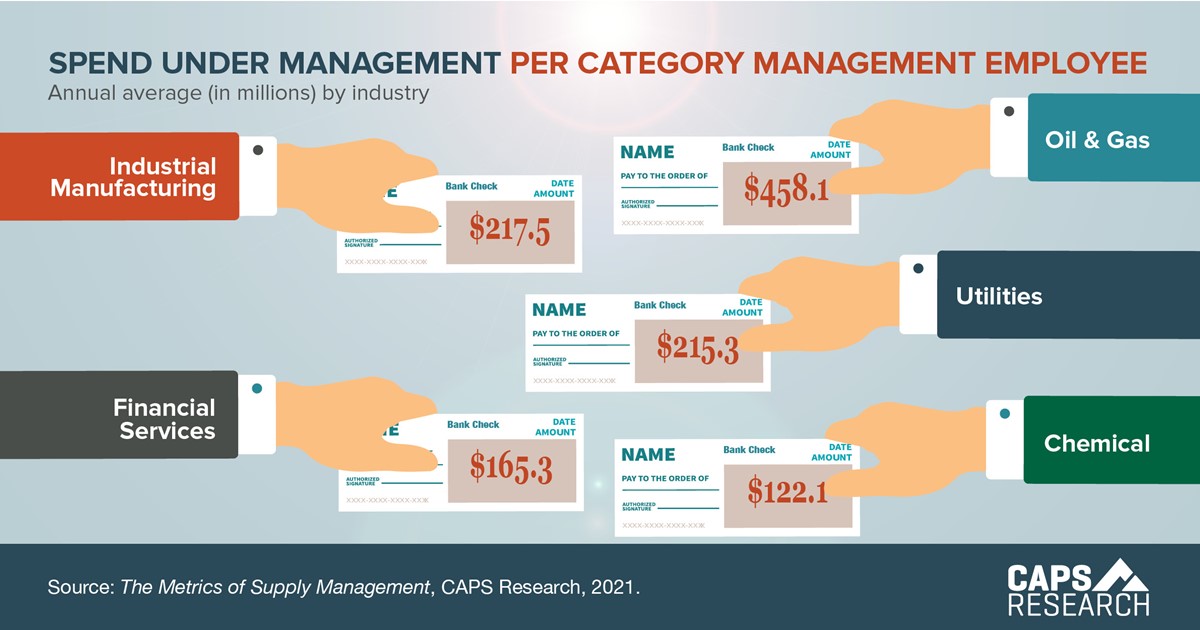
Spend Under Management
Across industries, category management employees comprise an average 17.9% of the total supply management headcount, but each SCM employee manages hundreds of millions of dollars.
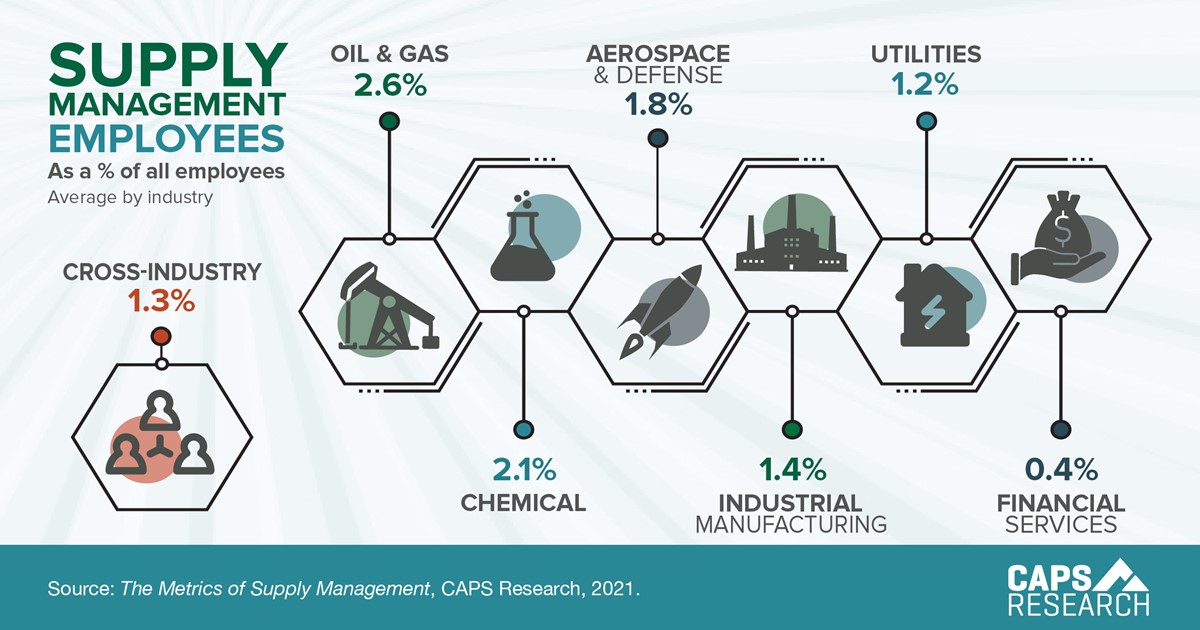
Supply Management Employees
Across industries, a mere 1.3% of the total headcount is supply management employees.
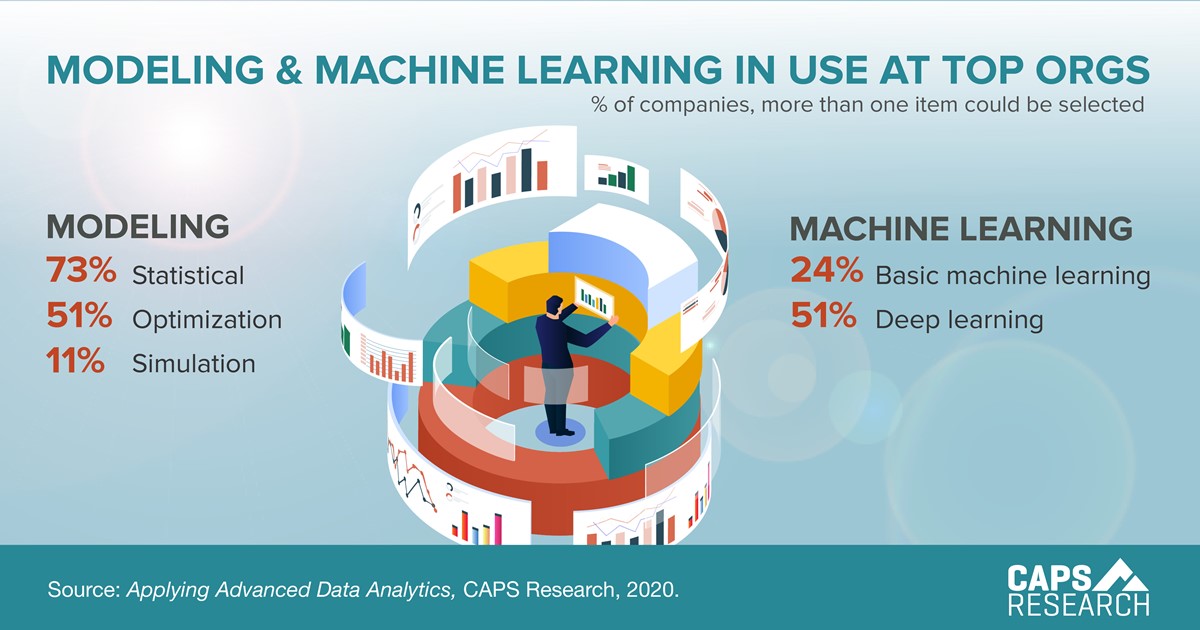
Modeling & Machine Learning In Use at Top Orgs
Of the companies we surveyed, 73% use statistical modeling and 51% use deep machine learning. More on how modeling & machine learning is used at top organizations can be found in the CAPS Research report, Applying Advanced Data Analytics.
Non-members can receive the report of each survey they submit.
Members can access all reports, but are encouraged to submit surveys to
increase the comparative breakouts only they receive.