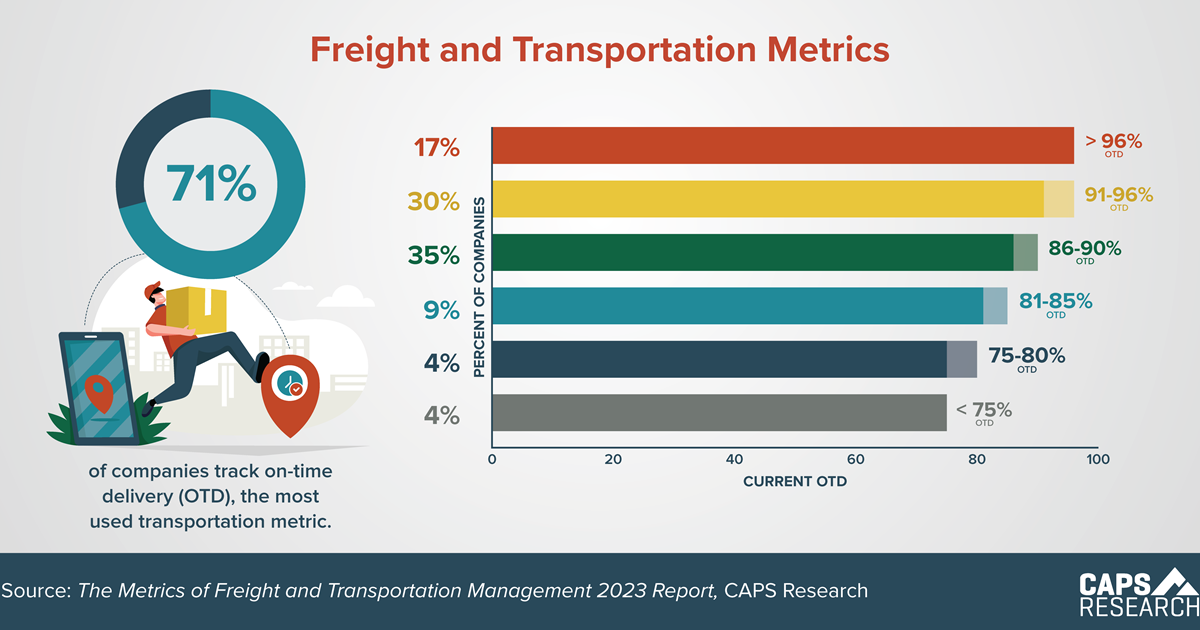
Typically, delivery performance is more critical for companies with lower inventory levels who operate using a just-in-time fulfillment model. Currently, 71% of companies track on-time delivery (OTD), the most used transportation metric. 47% of companies claim OTD is greater than 90%, while 8% of companies report OTD less than 80%.
Fleet Utilization and Management
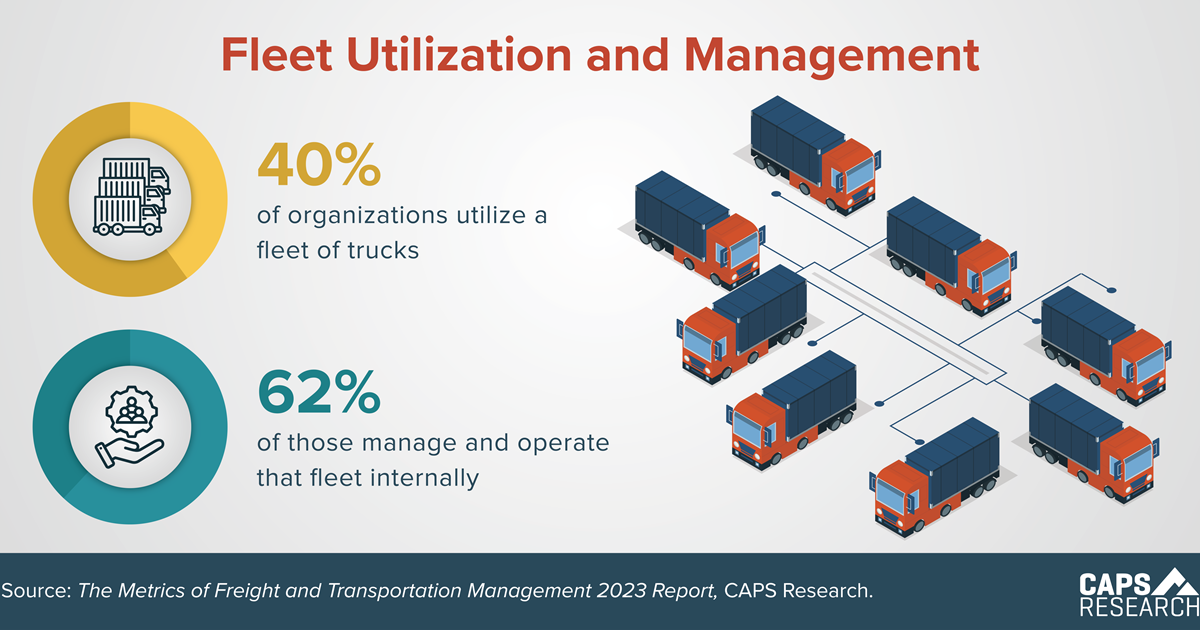
Most companies that operate a fleet do so to improve service levels and shorten lead times. According to a newly released CAPS Quick Poll, 40% of organizations utilize a fleet of trucks, and 62% of those manage and operate that fleet internally rather than outsourcing the management of that fleet.
Cost Savings Per Supply Management Employee
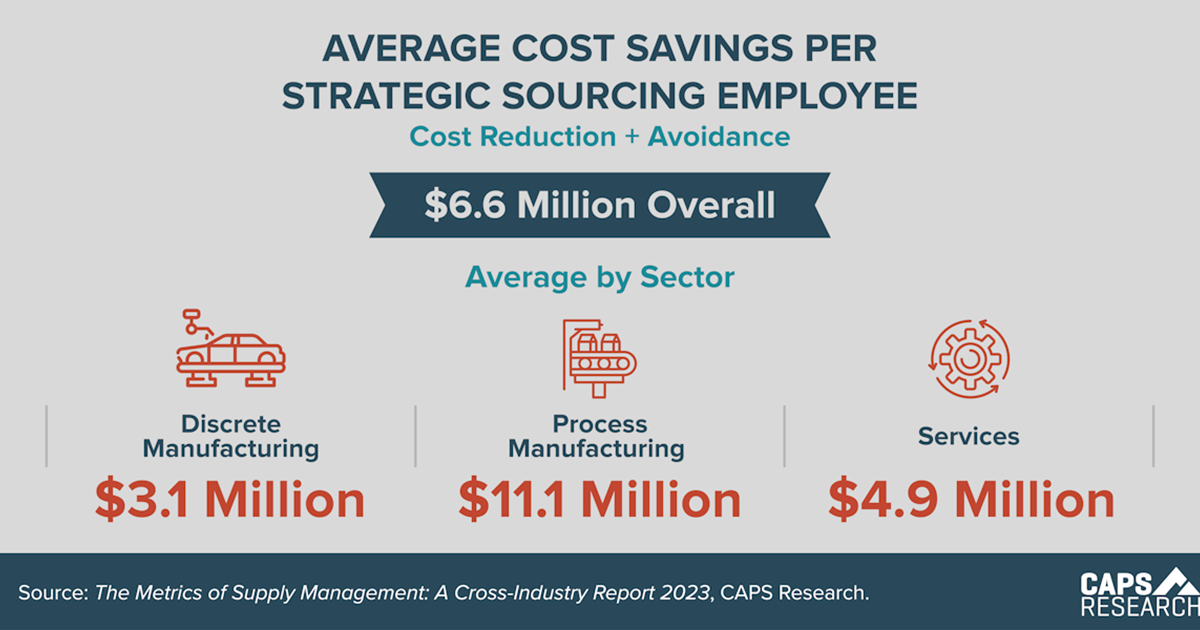
Cost savings is a powerful KPI for demonstrating the value of supply management to the business. On average, supply management employees are delivering $6.6 million in total savings. How does your company compare?
Risk Mitigation Strategies
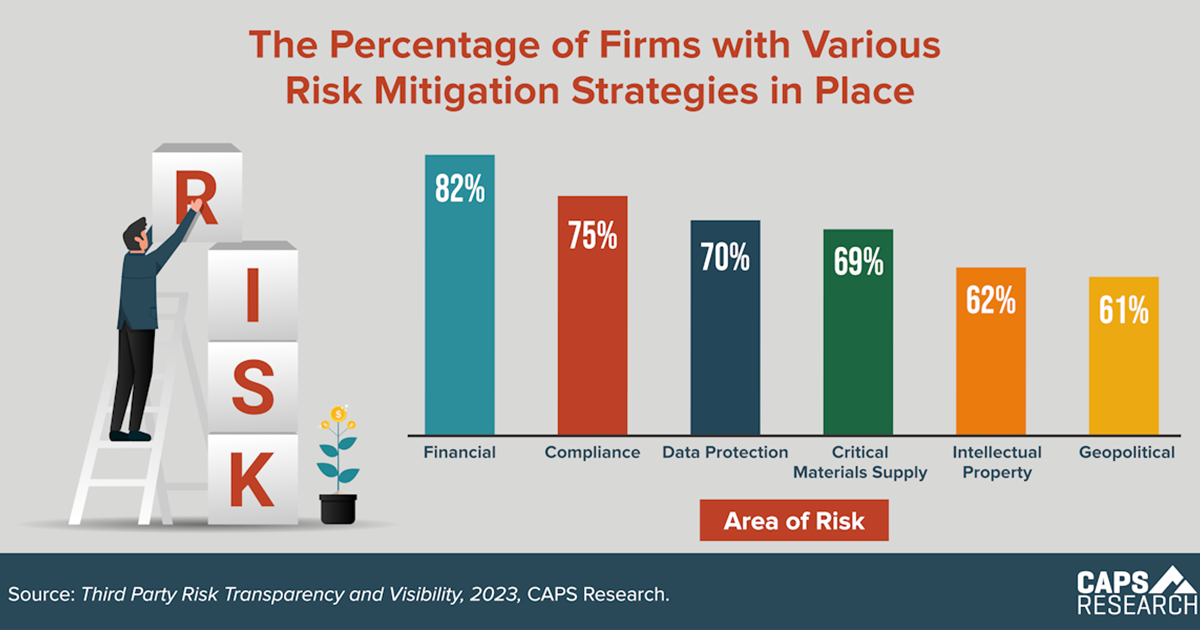
Mitigating supply chain risk has become increasingly important. A recent CAPS report shows that the percentage of firms with mitigation strategies in place for financial and compliance risks is the highest with geopolitical risk strategies being the least utilized.
Percent of SM Employees
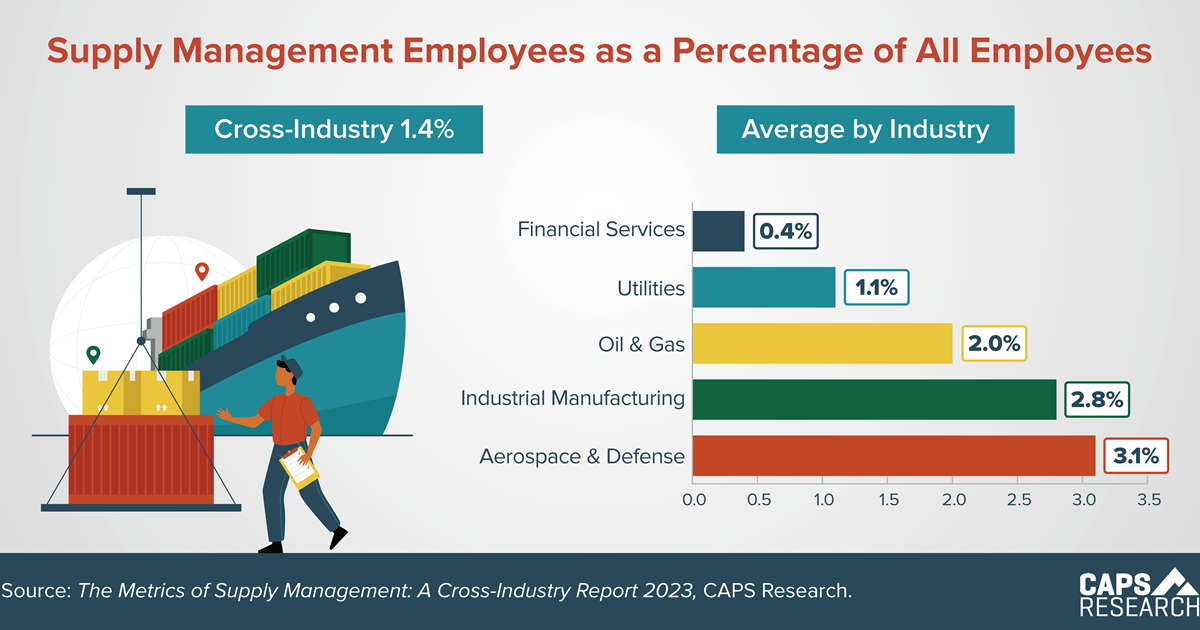
According to the CAPS MoSM report, only 1.4% of the total headcount across all industries are supply management employees. The overall percentage is the same as last year’s report, although there were some slight shifts within each industry.
Monitoring Supplier Risk
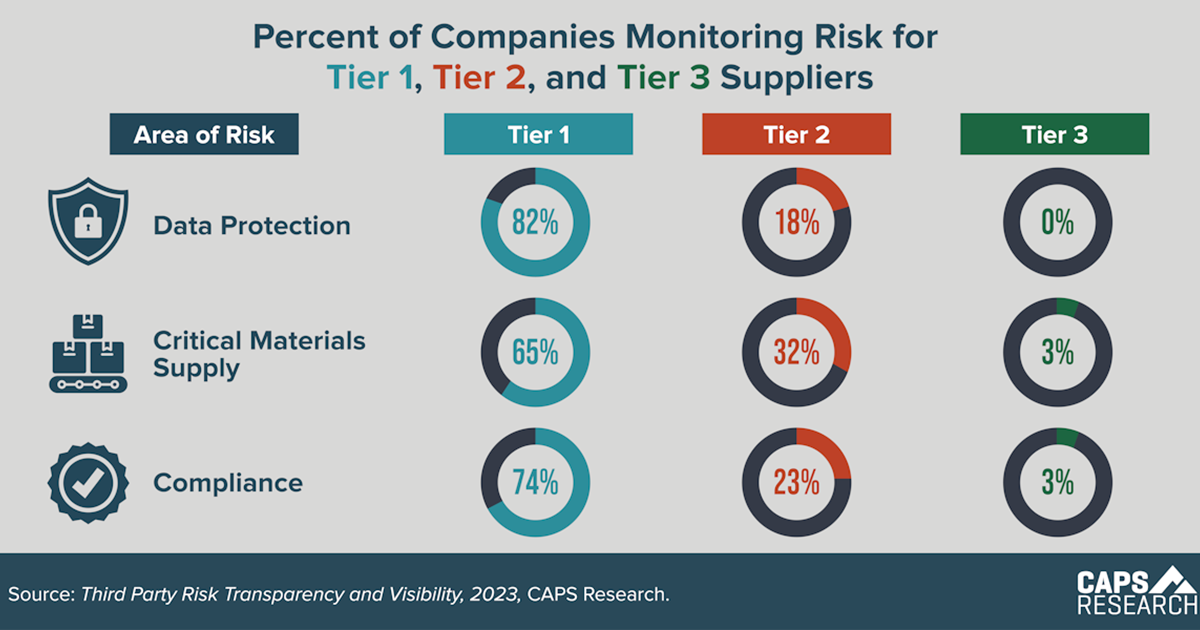
A recent CAPS report reveals that most companies are not monitoring common supply chain risks with Tier 2 suppliers and virtually none are monitoring Tier 3 supplier risks.
Tactical vs Strategic Buying
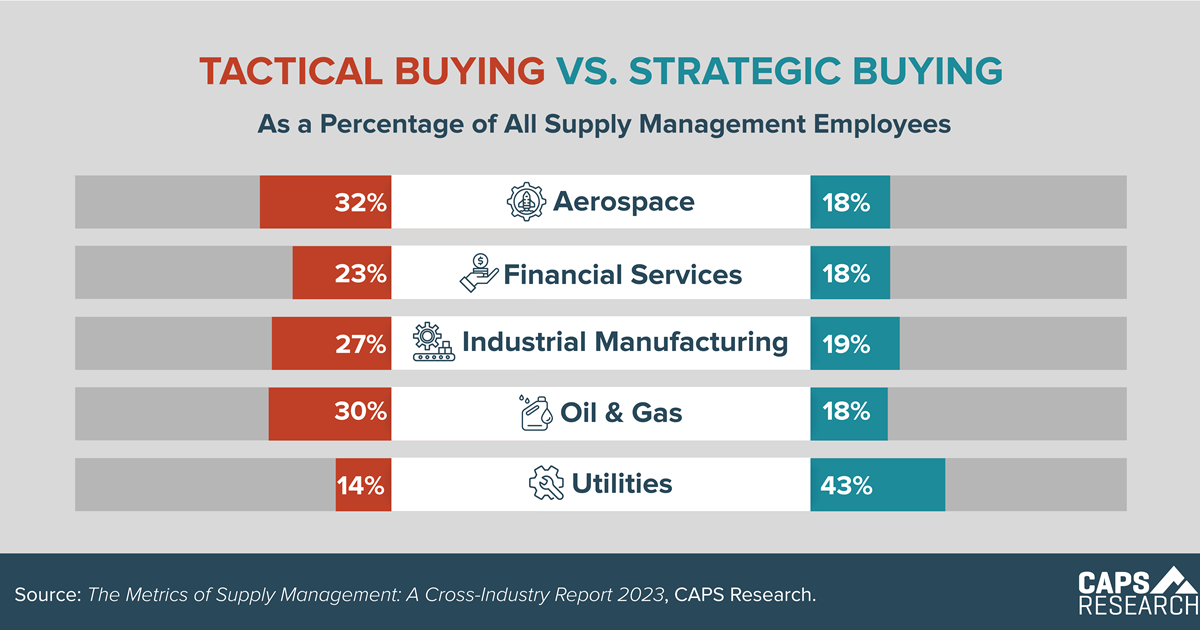
Tactical buying remains the biggest focus for supply management headcount, claiming 31% of resources. Strategic sourcing has the potential to produce greater value, but these resources are a smaller portion of the team mix.
Reasons Employees Leave
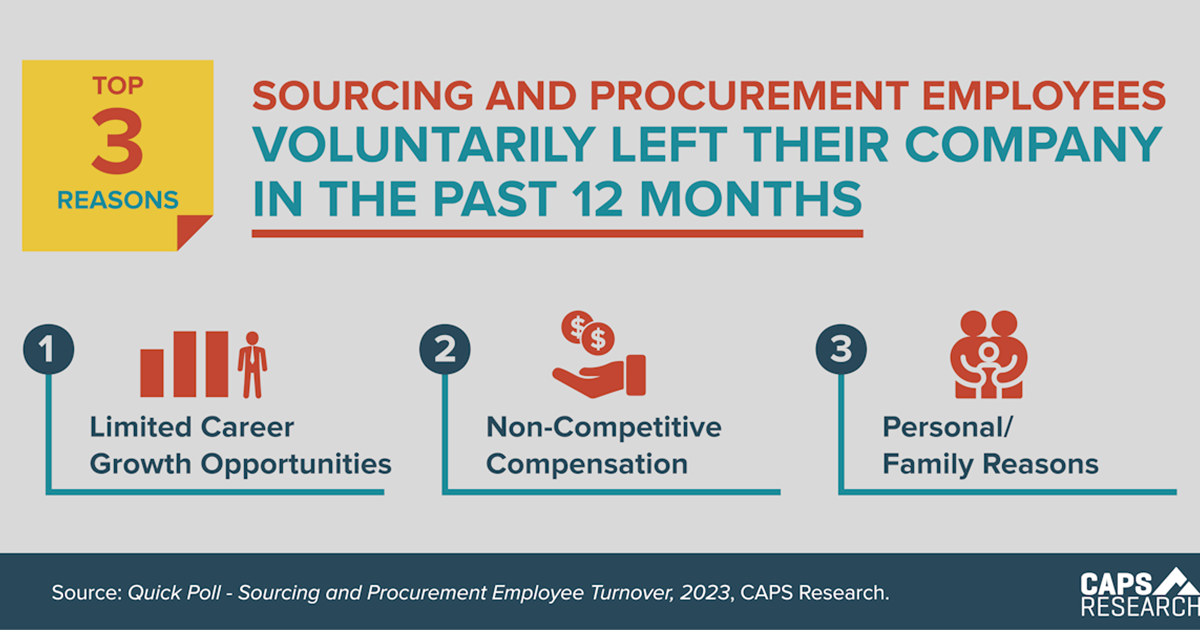
Quick Poll results reveal the top 3 reasons supply management employees voluntarily left an organization were because of limited career growth opportunities, non-competitive compensation, and personal/family reasons.
Supply Management ROI
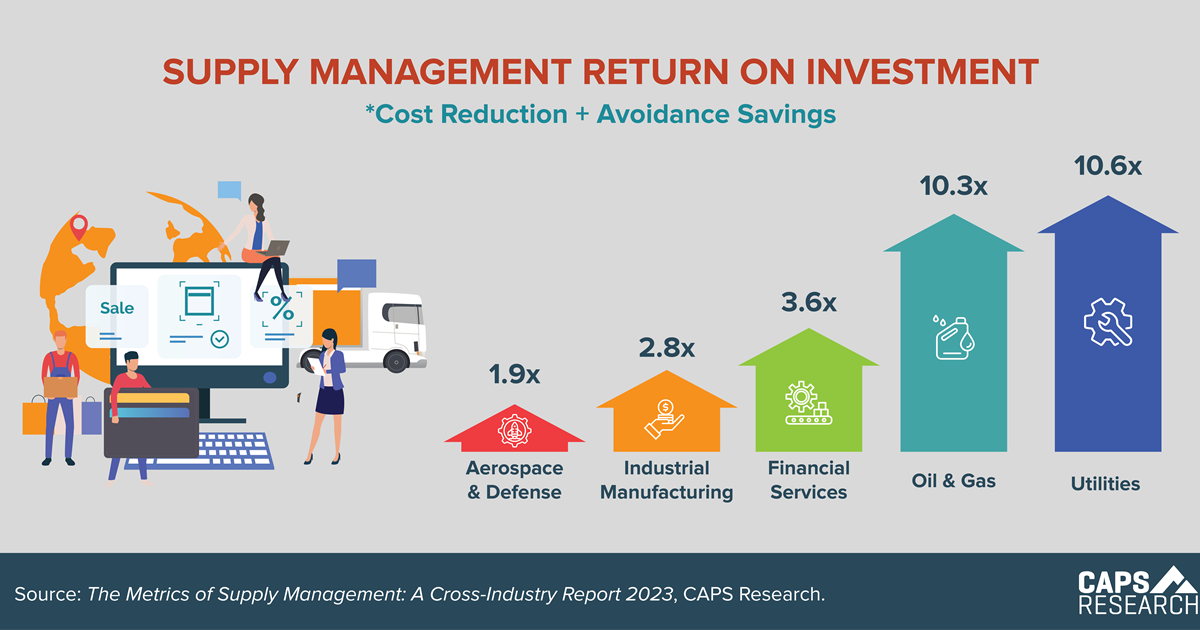
Supply management ROI is a simple way to communicate the value your supply management group delivers to stakeholders. In 2022, every US$1 invested in supply management returned $7.05, an average of all companies’ ROI using reduction + avoidance savings.
Top Procurement Software
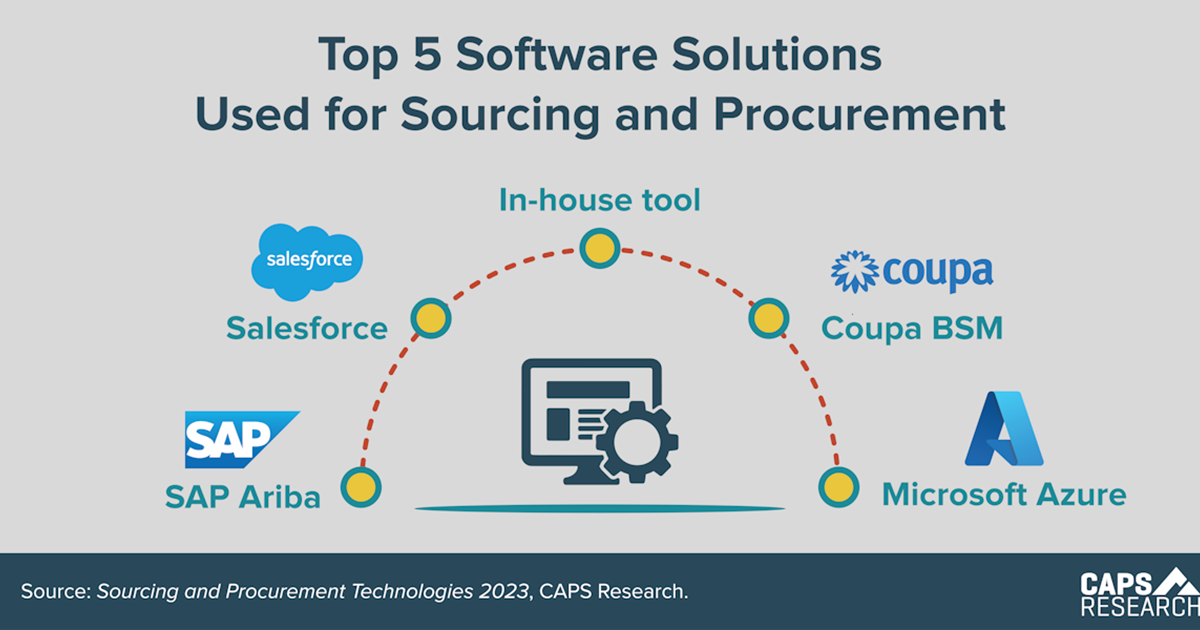
Based on a recent CAPS Research survey, the top 5 software solutions being used for sourcing and procurement are SAP Ariba, Salesforce, In-house tools, Coupa BSM, and Microsoft Azure.
Non-members can receive the report of each survey they submit.
Members can access all reports, but are encouraged to submit surveys to
increase the comparative breakouts only they receive.
