Across discrete, process, and services sectors, Generative AI is moving quickly from exploration to integration. Over just 15 months, organizations reporting “no use” of AI dropped by more than half, while moderate and large-scale adoption rose sharply. The data shows a clear inflection point: organizations not using AI declined from 38% to 15%, while those adopting it to a moderate extent grew from 9% to 37%, and large-scale adoption emerged at 4% by mid-2025. These trends signal accelerating maturity as organizations shift from testing AI concepts to embedding them into core supply chain and business operations.
SM Organizational Design
The 2025 Metrics of Supply Management Report shows 46% of organizational designs are center-led or centralized, while only 8% are decentralized. Companies that undergo organizational structure changes as part of an enterprise-wide initiative or market-driven decision face a huge endeavor, but data indicates these changes occur infrequently.
Strategic MFG FTE Savings
The CAPS Metrics of Supply Management research data confirms that strategic sourcing and strategic buying roles deliver the most leverage per employee across both discrete and process manufacturing. Even with post-pandemic normalization, efficiency and value creation per strategic FTE continue to rise, particularly among organizations that shifted from transactional work to more strategic sourcing, supplier collaboration, and risk management.
Strategic vs. Tactical Buying
Transactional or Tactical buying remains the primary focus for supply management headcount, accounting for 56% of resources. Strategic sourcing has the potential to produce greater value, but these resources make up a smaller portion of the team mix at 44% overall. This highlights a key imbalance in procurement resource allocation: while strategic sourcing can drive greater long-term value, most teams remain focused on transactional tasks. Procurement professionals must recognize this gap to advocate for shifting resources toward more strategic activities that enhance cost savings, supplier innovation, and competitive advantage.
Measuring Cost Savings
Every supply management organization tracks cost savings, but not all define it the same way. While every team surveyed measures price reductions, fewer include cost avoidance or negotiated savings against prior spend. Many CFOs and executives discount cost avoidance as “soft savings,” creating a disconnect between procurement’s reported value and what the C-suite recognizes. How aligned are your savings metrics with your leadership’s definition of value?
Supply Management ROI
Supply management ROI is a simple way to communicate the value your supply management group delivers to stakeholders. The overall 2025 ROI is 1031%. Another way to express this ROI: for every US $1 invested in supply management, the function returned $10.31 on average in reduction + avoidance savings. What other function can claim this type of return?
Collecting COIs
Nearly half of procurement teams wait until after contracts are signed to collect Certificates of Insurance, leaving gaps in coverage and compliance. Those who collect earlier, during onboarding or before work begins, are better positioned to manage supplier risk and avoid costly surprises down the road.
Percent of Headcount
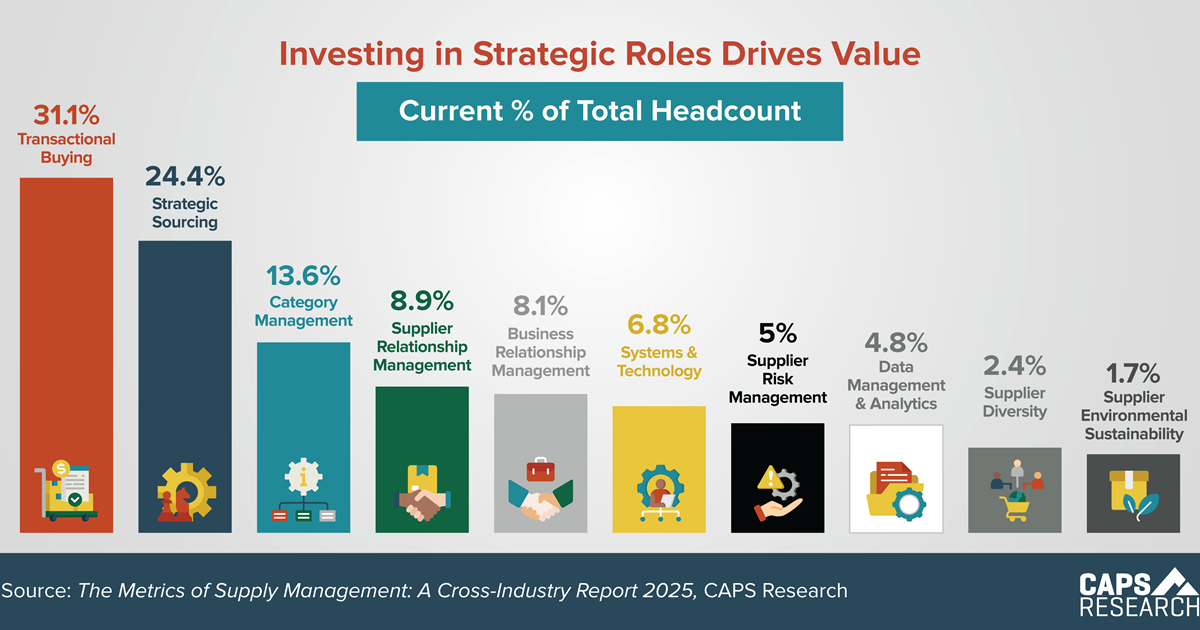
According to the 2025 CAPS Metrics of Supply Management report, 31.1% of the total headcount is in the tactical role of transactional buying. As companies identify priorities and fill gaps, strategic hiring of supply management professionals should help reduce the proportion of tactical roles that could be transitioned to a shared services group.
Payment Terms
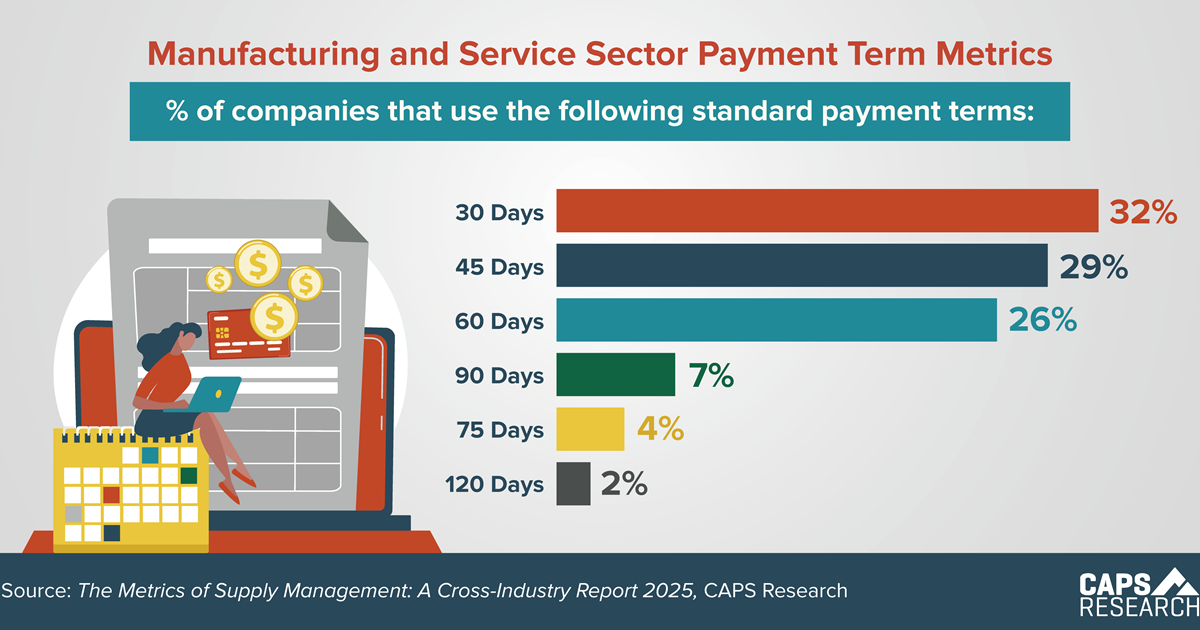
Across the manufacturing and service sectors, the largest percentage of companies, 32%, use 30-day payment terms. Meanwhile, 29% use 45-day terms, 26% use 60-day terms, 7% use 90-day terms, and only 6% report using 75- or 120-day terms. Understanding common payment terms is important for procurement professionals to align with industry standards, negotiate effectively, and manage cash flow.
Gen AI Stress Testing
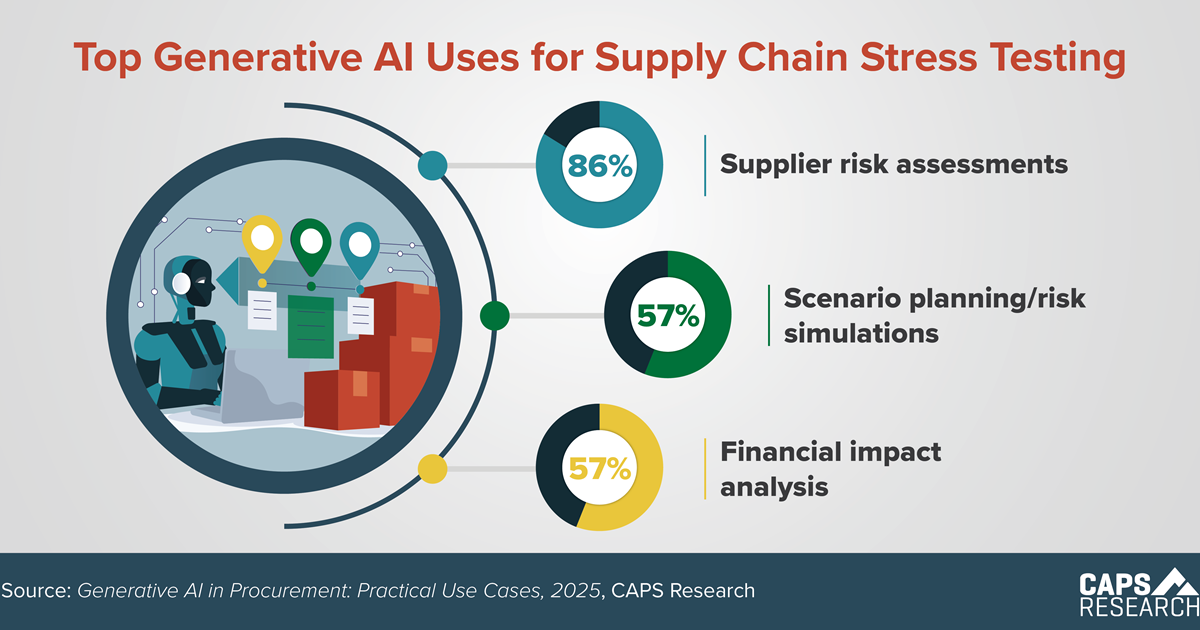
18% of supply chain organizations regularly conduct stress testing using Generative AI for supplier risk assessments, scenario planning/risk simulations, and financial impact analysis. By leveraging AI for these tasks, procurement teams can make more informed, proactive decisions to strengthen resilience and reduce business risk.
Non-members can receive the report of each survey they submit.
Members can access all reports, but are encouraged to submit surveys to
increase the comparative breakouts only they receive.


