CAPS infographic archive
CAPS infographics are published biweekly and feature supply management KPIs and compelling benchmarking metrics. Please review the most current infographics on our blog and if you're interested in timely, customized metrics, check out our benchmarking program.
9/30/18
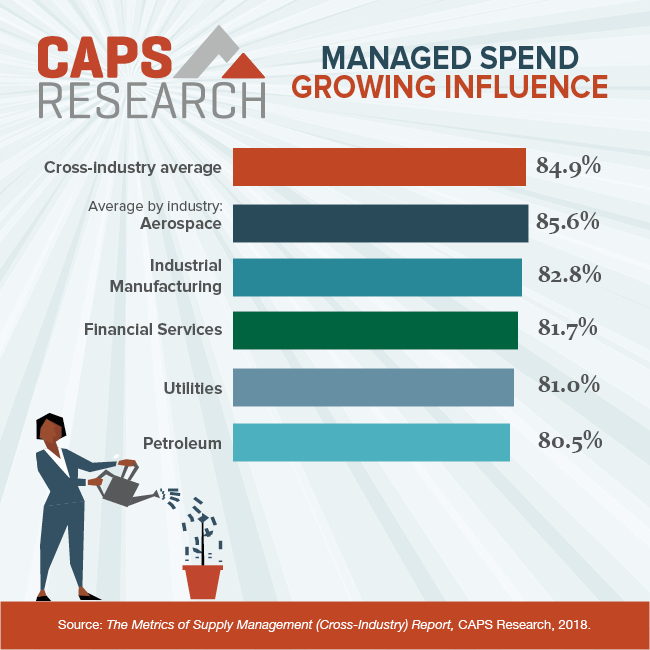
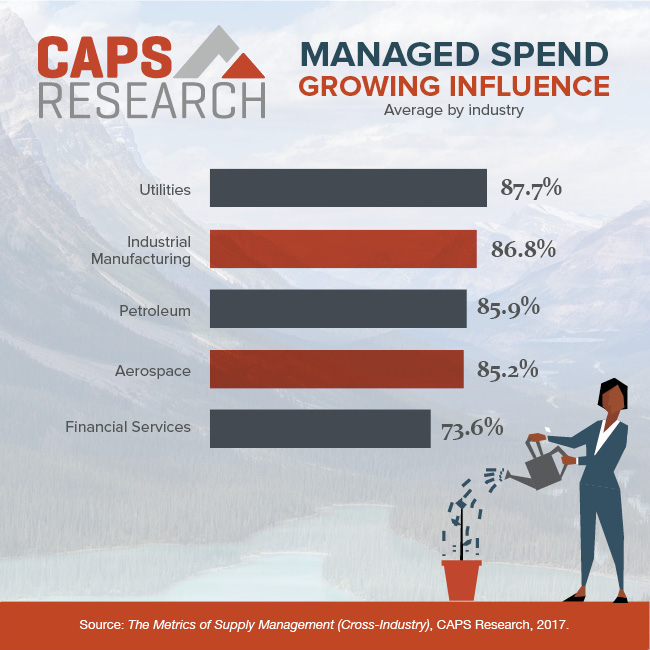
Managed Spend: Growing Influence
Teams with high levels of managed spend are better able to leverage spend, mitigate supplier risk and bring more strategic value to the organization. Which spend areas are managed or influenced by your team? Which ones are not managed/influenced and why?
8/30/18
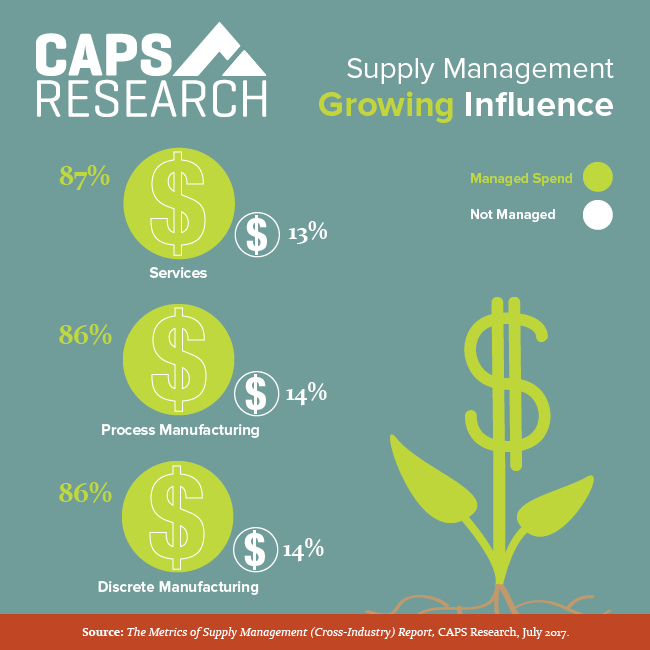
Managed Spend by Sector
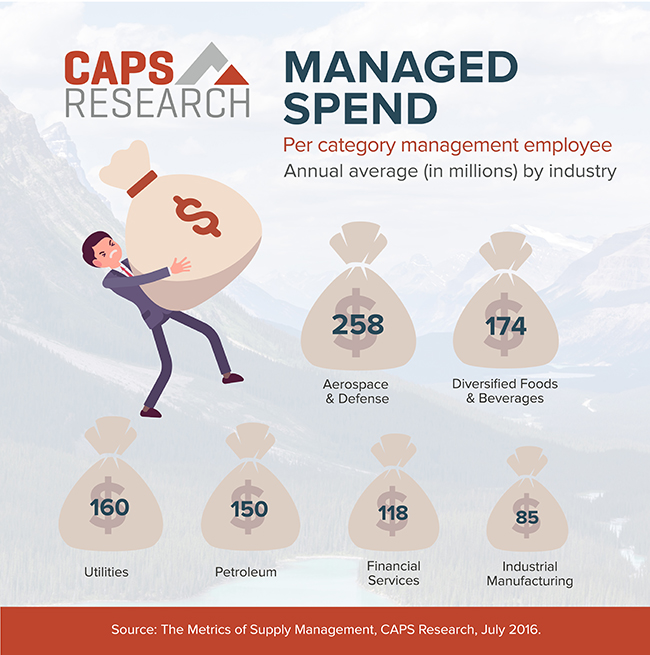
Managed or sourceable spend is increasingly being managed by supply management and procurement groups. This growing influence results in a more strategic approach, increased savings, and greater protection from supplier risk. On average, 85 percent of spend for all companies, regardless of sector, is managed. How does your company compare?
Source: The Metrics of Supply Management (Cross-Industry) Report, CAPS Research, July 2018.
8/16/18
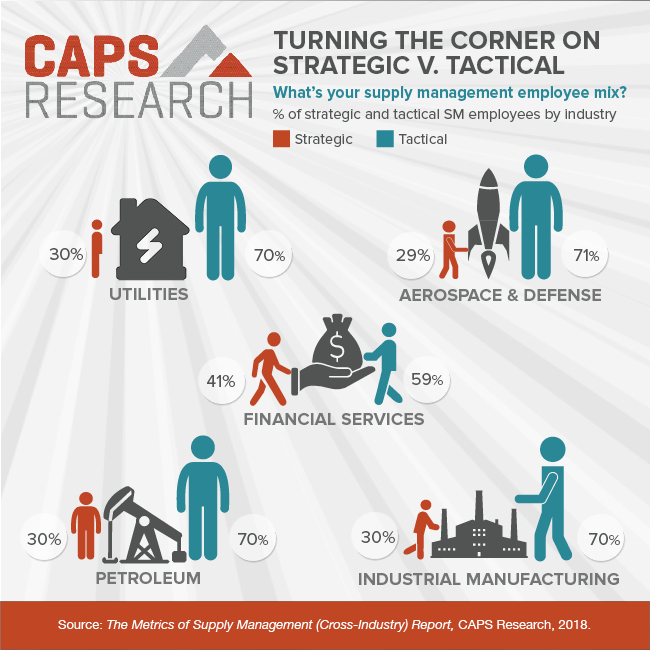
Turning the Corner of Strategic v. Tactical
The average supply management group is 65 percent operational employees and 35 percent strategic employees. Operational employees are primarily engaged in the day-to-day, tactical procurement activities that support the business, while strategic ones engage in high-level activities like category management, supplier relationship management, and stakeholder engagement. How does your organization compare?
Source: The Metrics of Supply Management (Cross-Industry) Report, CAPS Research, 2018.
7/13/18
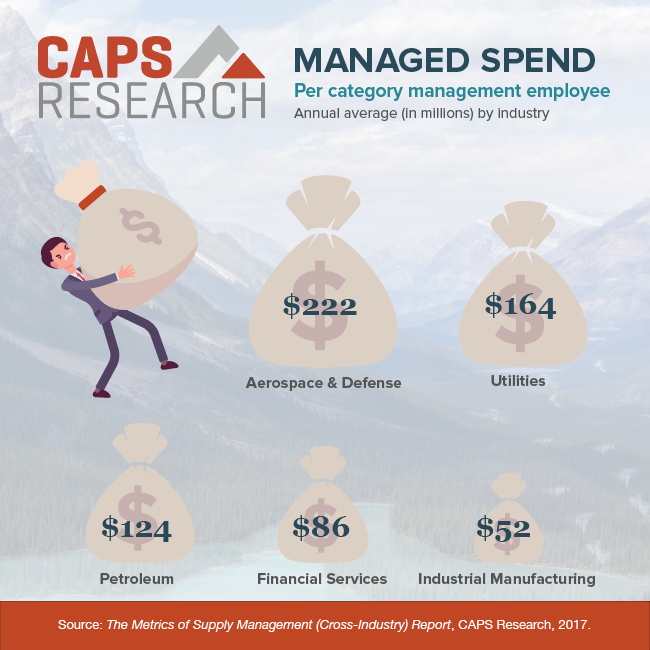
Category employees are on the front lines of managing sourceable spend. That growing influence gives organizations a more strategic view, increased savings, and protection from supplier risk. It could also mean more investment in category resources and even new category employees.
6/28/18
6/21/18
5/03/18
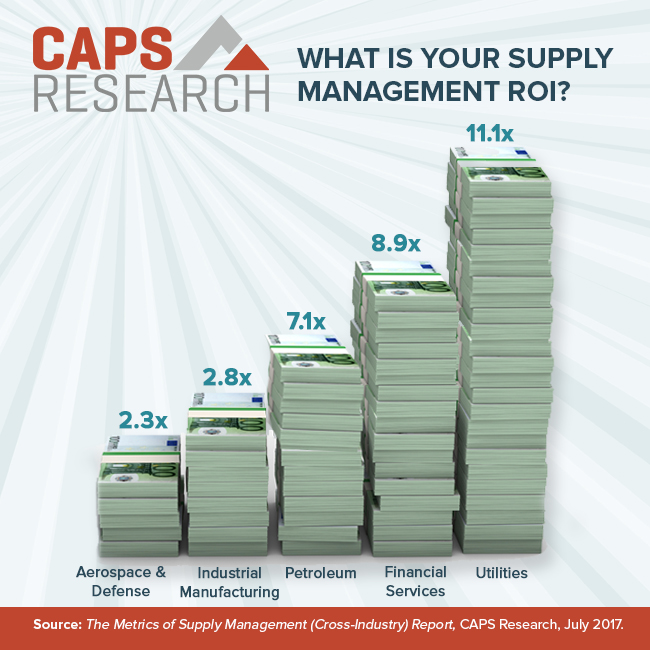
Supply management ROI continues to grow in popularity as a simple yet powerful way to demonstrate value of the function. The Supply management ROI is calculated by dividing cost savings (reduction plus avoidance) by supply management operating expenses. Tell your stakeholders about the value you deliver. Every US$1 invested in supply management returns $7.23 (based on 2017 average of all companies using reduction-plus-avoidance savings in the calculation).
6/1/18
Sourceable spend is increasingly being managed by supply management/procurement groups. This growing influence results in a more strategic approach, increased savings, and greater protection from supplier risk. On average, 86% of spend for all companies, regardless of sector, is managed. How does your company compare?
4/19/18
4/05/18
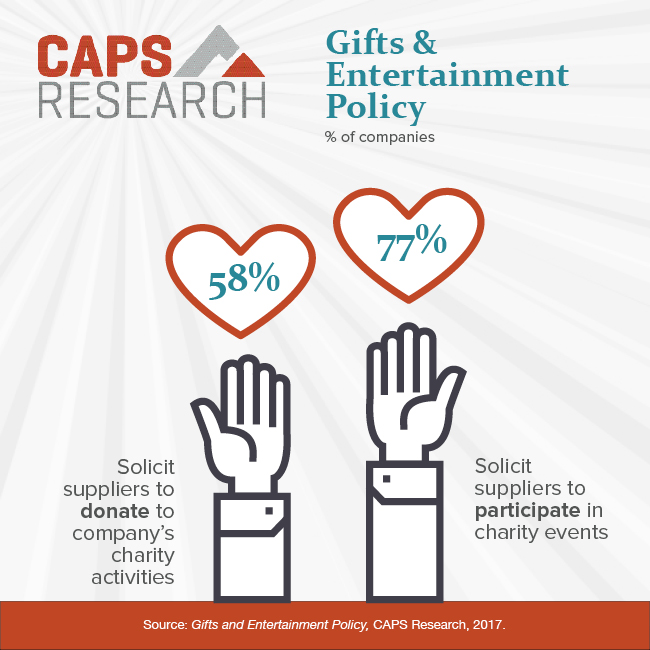
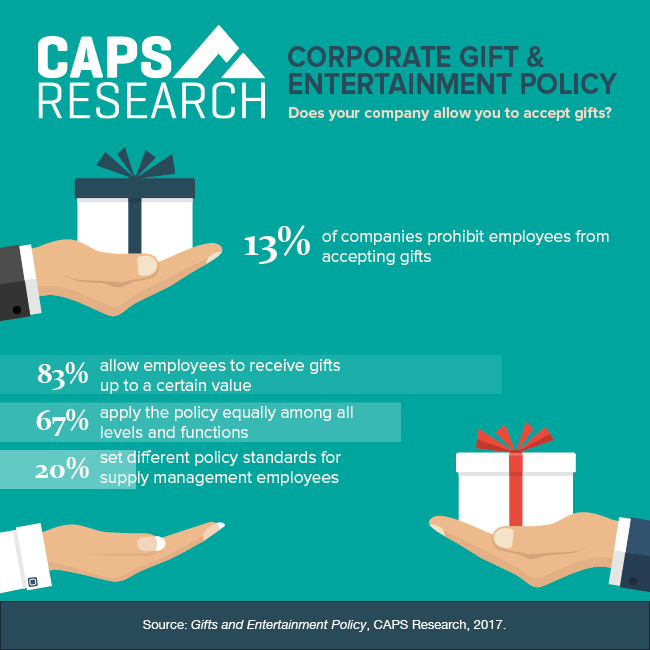
Since supply management professionals are instrumental in business decisions involving suppliers and clients, they must pay close attention to their companies’ gift and entertainment policies. Standards can differ for supply management employees versus the full employee base. Of the companies we surveyed, 41 percent have implemented a stricter gift policy in the last five years.
3/15/18
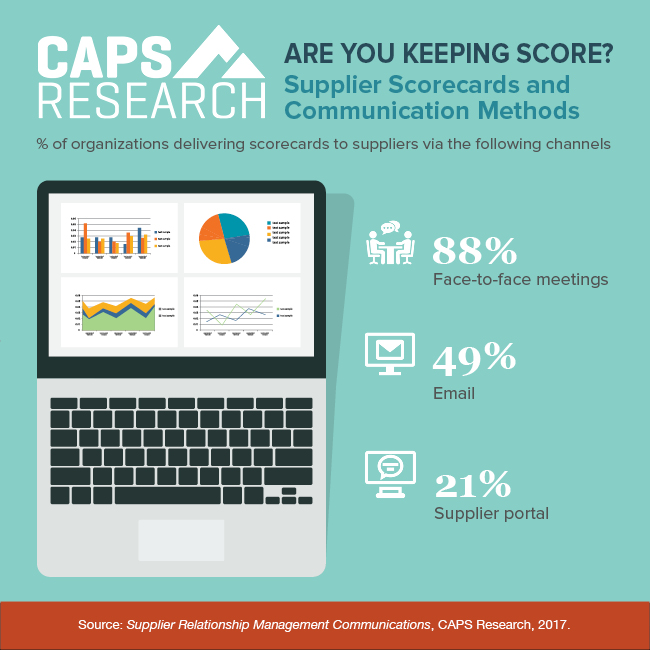
How are you keeping score of your suppliers? In a recent survey, 73 percent of responding organizations use scorecards; 88 percent are delivering them to suppliers in face-to-face meetings, most commonly on a monthly basis.
3/08/18
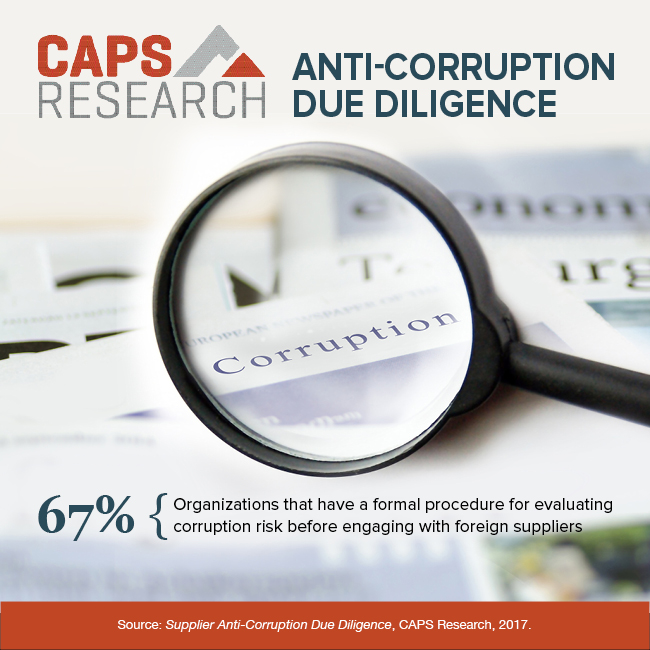
Anti-Corruption Due Diligence
Of the companies we surveyed, 67 percent have a formal procedure for evaluating corruption risk with foreign suppliers and contractors. On average, organizations report 13 percent of their suppliers are categorized as a potential high risk for corruption. Characteristics that place suppliers in the high-risk category include geographic location, governmental ties, and funding sources.
2/22/18
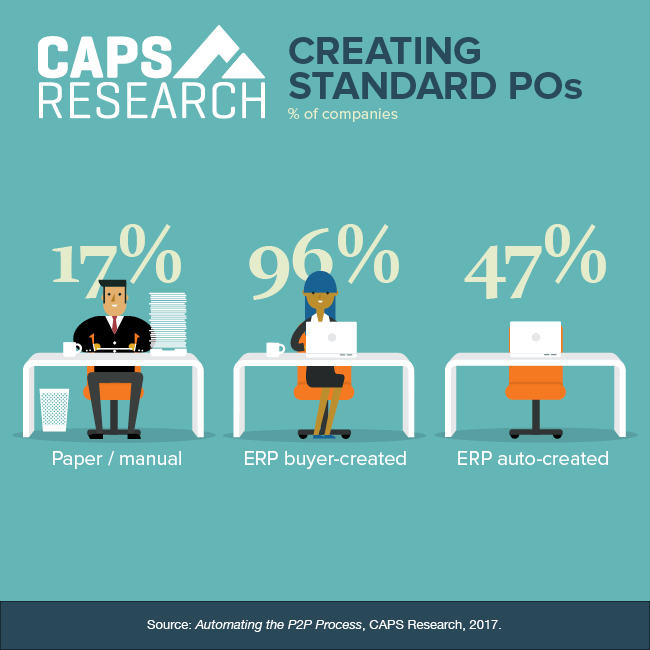
As companies continue to move toward digitization, 47 percent report using enterprise resource planning (ERP) to auto-create purchase orders (PO). Paper and manual POs are still used at 17 percent of companies. What steps are you taking to automate the PO process?
2/08/18
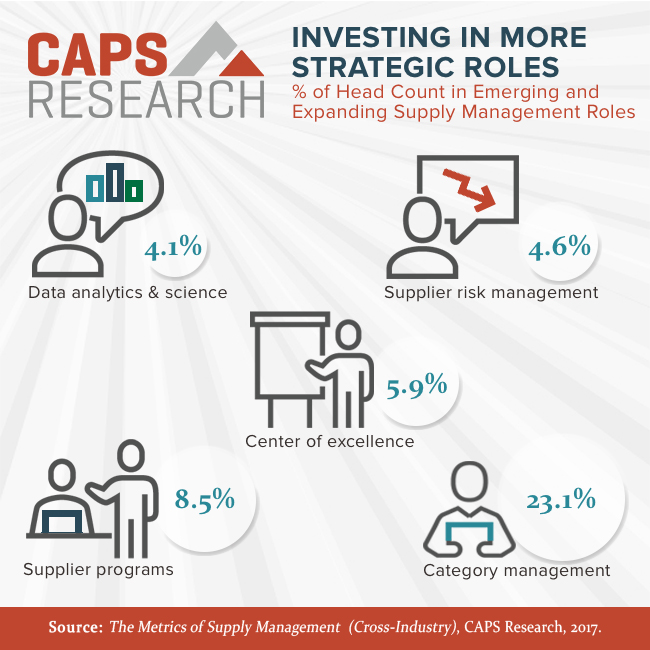
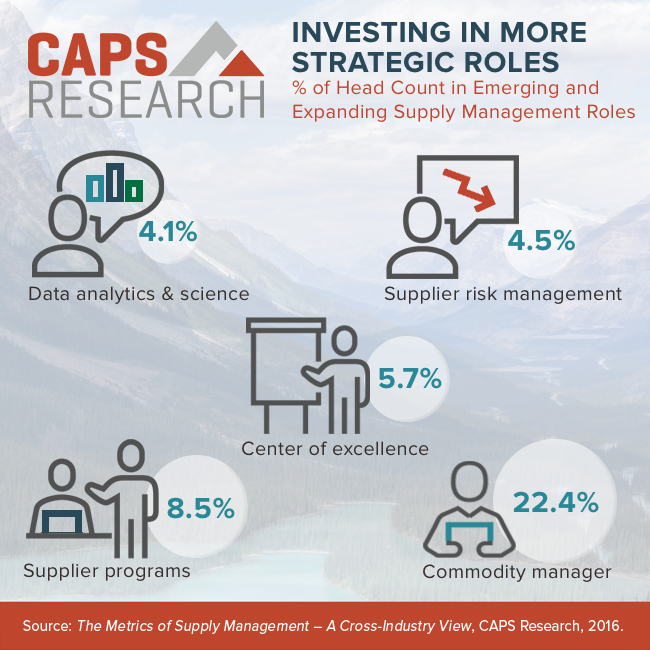
Organizations continue to invest in new roles as they design the supply management organization of the future. More priority is being given to data analytics, supplier risk and improved integration with the business.
2/1/18
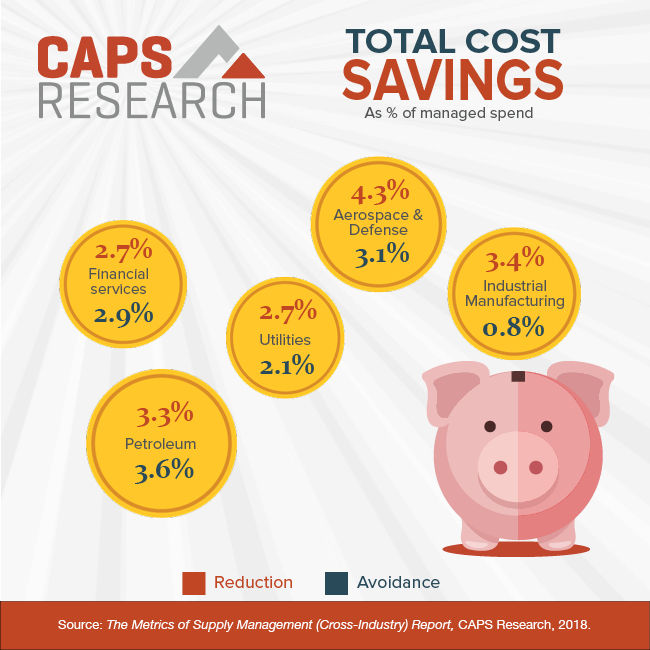
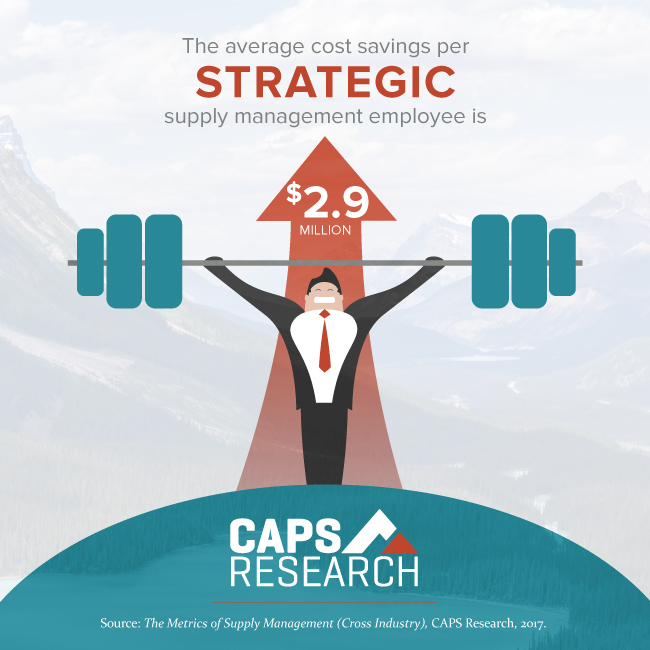
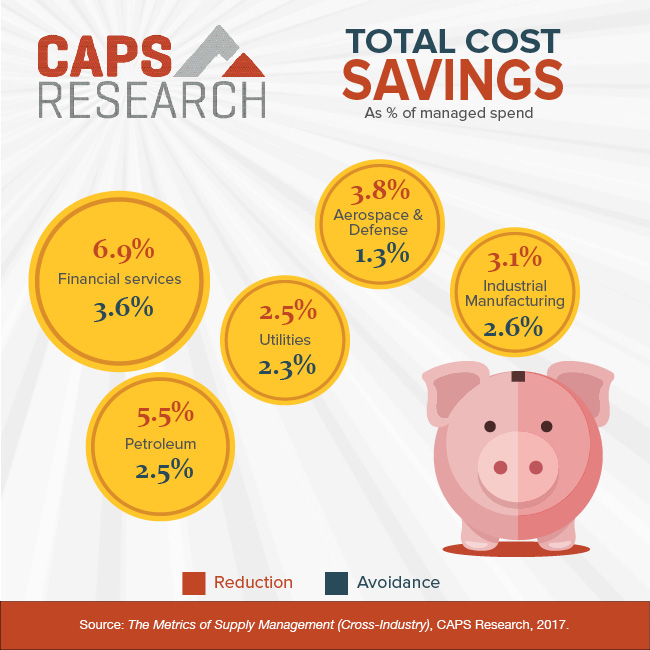
Of all the KPIs that show the value of a supply management group, cost savings is the most vital. The cost savings generated by strategic supply management employees makes them extremely valuable to an organization. How much total cost savings (reduction and avoidance) are your strategic supply management employees delivering?
1/25/18
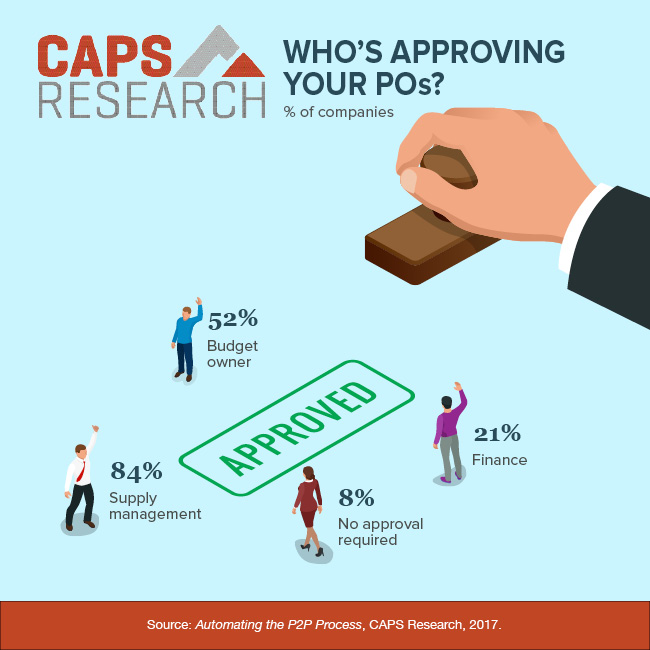
Proper controls are in place for the approval of purchase orders (POs), with 84 percent of organizations reporting that supply management is part of the approval process.
1/18/18
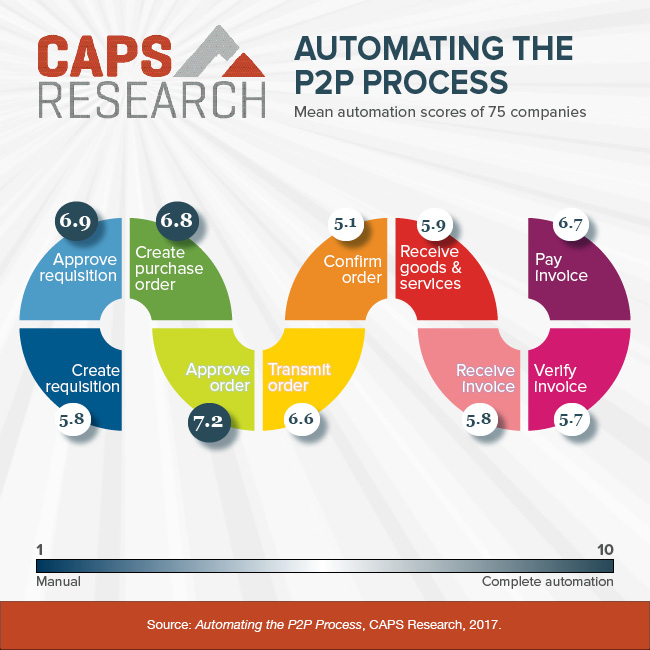
Automation and digitization of the procure-to-pay (P2P) process are driving efficiency within companies, as indicated using a 10-point scale for each step. The P2P areas furthest along in automation are approval of orders, approval of requisitions and creation of purchase orders.
12/7/18
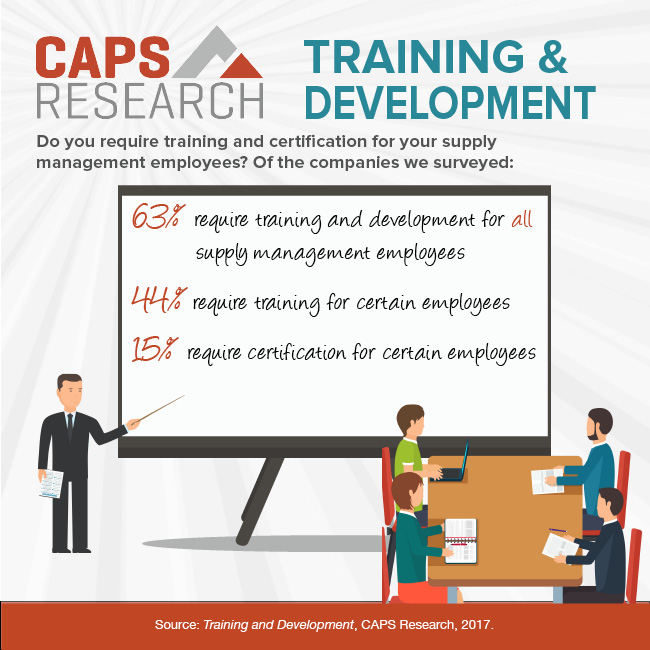
Negotiations, sourcing and contract management are the leading training topics at most companies. Of the companies we surveyed, 63 percent require training for all supply management employees, and 15 percent say they require supply management certification for certain roles. Training and development is a priority, reflected in the fact that only 3 percent of companies do not have course offerings.
11/14/17
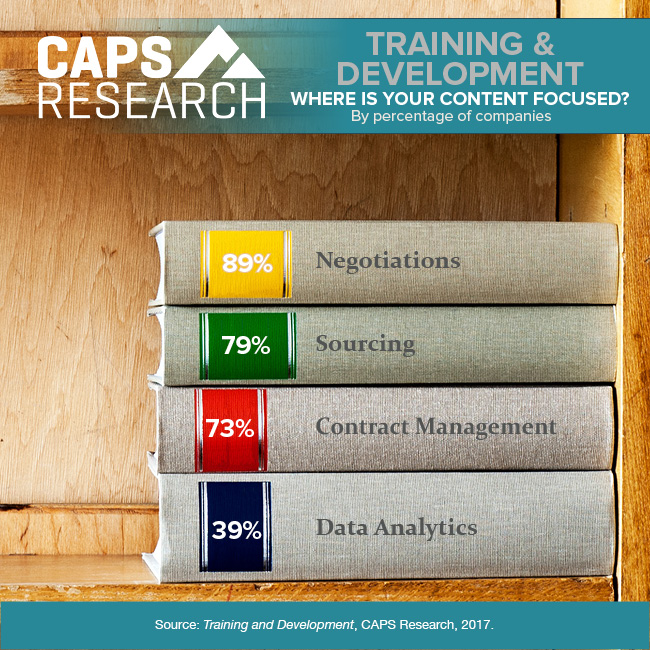
Negotiations and sourcing continue to be the leading topics of training at most companies. Such areas as data analytics and supply chain financing are beginning to emerge but have not yet had widespread adoption in training and development content.
10/26/17
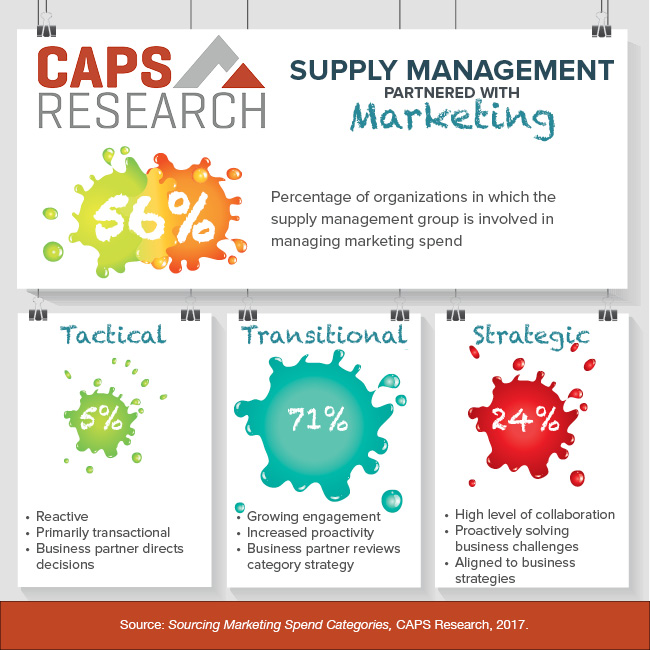
Of organizations surveyed, 56% say the supply management group is involved in the marketing spend category, but only 24% of organizations have achieved high levels of strategic involvement.
10/12/17
How much of your organizational spend is influenced by your supply management or procurement team? Teams with high levels of managed spend are increasing their opportunity to leverage spend, mitigate supplier risk and bring more strategic value to the organization. Which spend areas are managed or influenced by your team? The challenging categories continue to be legal, HR, marketing, IT services and engineering services.
9/28/17
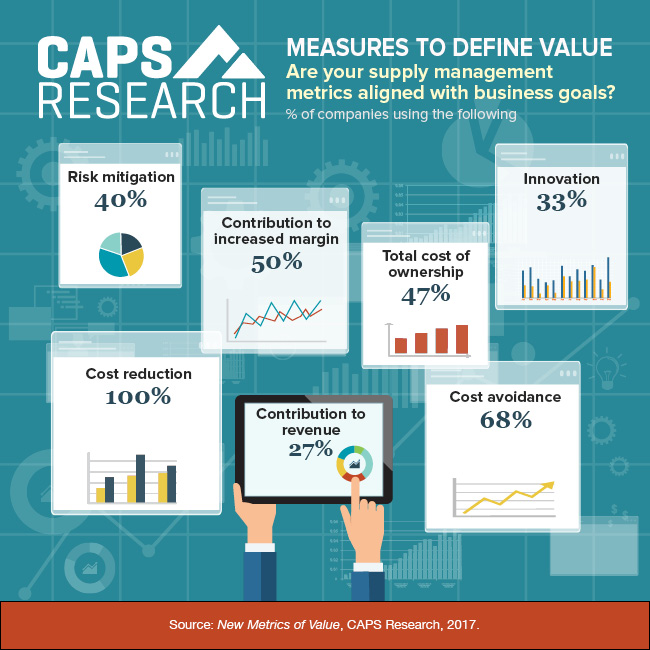
As supply management groups deliver greater strategic value to the organization, new measurements that align with business goals are emerging. However, cost savings is still the most popular measurement used to communicate the value of the supply management group, with cost reduction savings leading the way. In a separate report (New Measures of Value, 2017), 100 percent of companies indicated they measure cost-reduction savings, and 79 percent indicated they measure cost-avoidance savings.
9/21/17
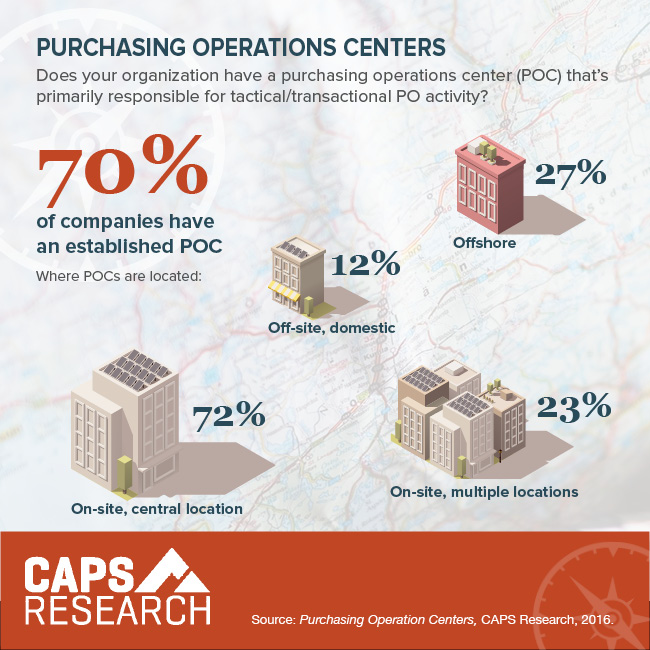
70% of companies have established purchasing operations centers (POC) for transactional PO activity; 58% of them use a POC as a training ground for career advancement into more strategic or complex supply management roles.
8/31/17
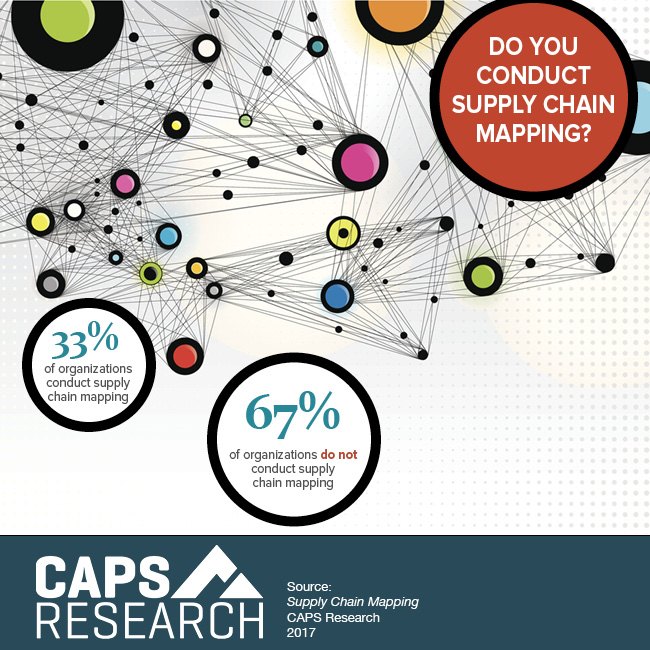
Thirty-three percent of organizations conduct supply chain mapping. Of those, 41 percent indicate their tier-one suppliers are currently mapped, and 28 percent outsource some or all of their mapping activity. Of the 67 percent of companies that do not perform supply chain mapping, 14 percent plan to start in the next 12 months.
8/17/17
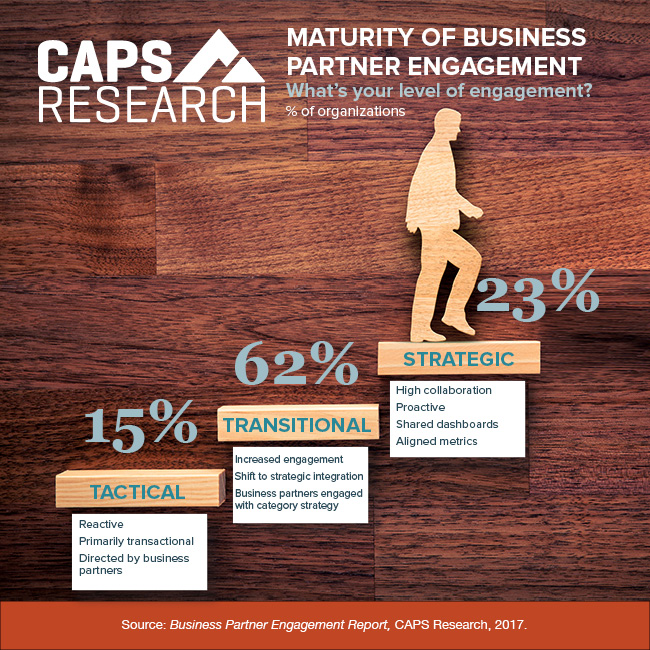
Aligning and integrating with the business has become a high priority for supply management leaders as they drive strategic value into their companies. Most companies (62 percent of respondents) report they are at the transitional level.
8/3/17
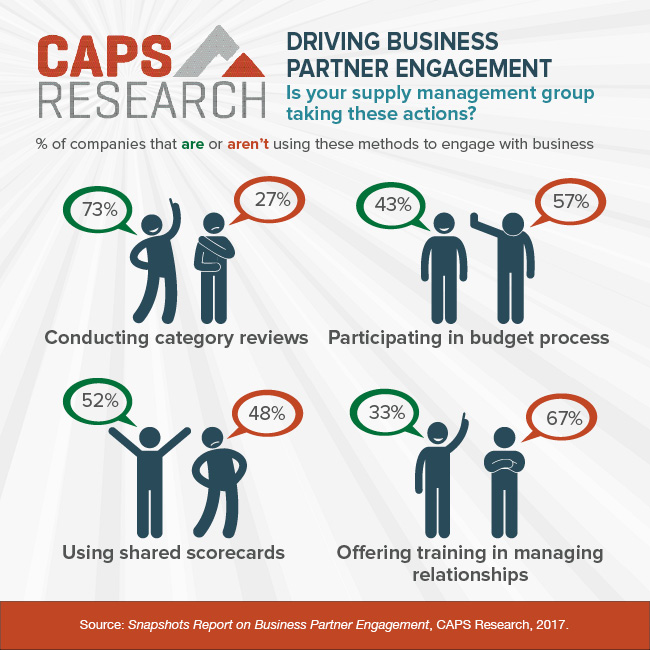
Conducting category reviews is one of the first steps a supply management group should take to engage internal business partners. Category reviews and additional actions can result in better integration and alignment with partners.
7/20/17
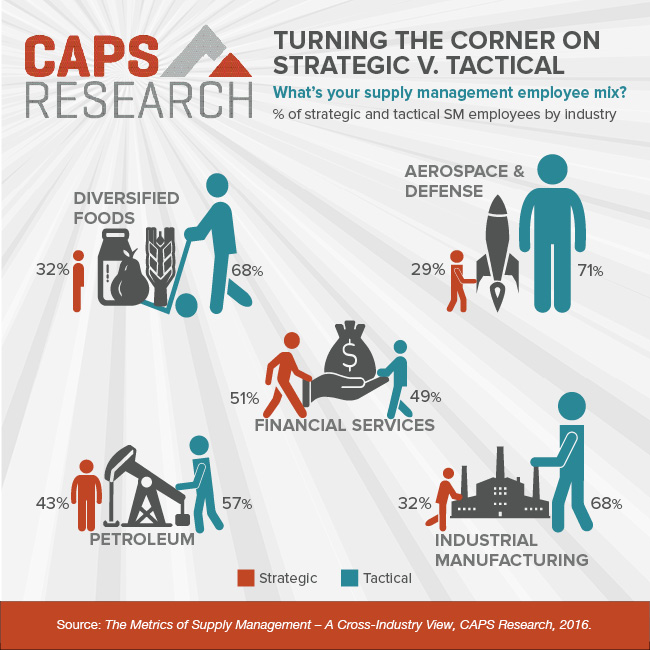
The average supply management group is comprised of 62 percent operational employees and 38 percent strategic employees. How does your organization stack up? Operational employees are primarily engaged in the day-to-day, tactical procurement activities that support the business, while strategic ones engage in high-level activities like category management, supplier relationship management, and stakeholder engagement. How does your organization divide strategic versus tactical staffing?
7/13/17
While cost reduction and cost avoidance remain popular, supply management groups are using additional measurements of their contribution to corporate KPIs. Supply management groups have metrics that are outward facing, aligned with business goals and part of shared scorecards with internal business partners.
7/6/17
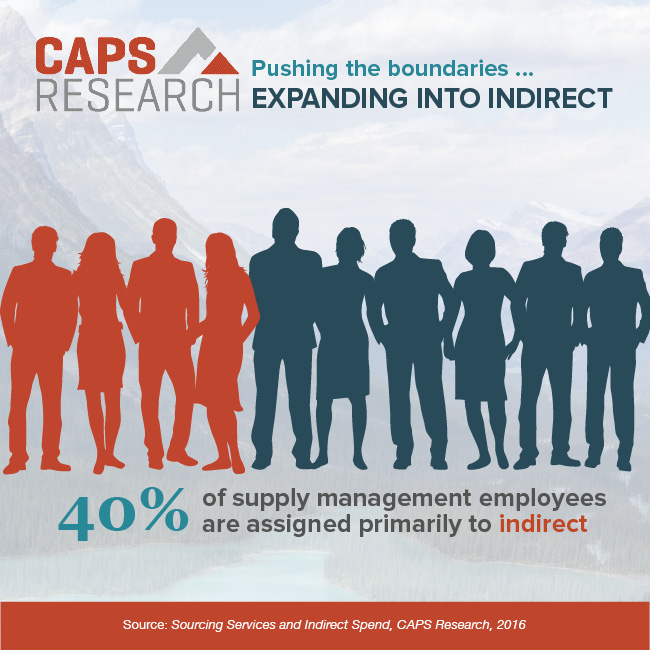
As supply management pushes the boundaries of managed spend, more companies are expanding into indirect spend categories. Forty percent of supply management employees are assigned to indirect, and of those, 44 percent are in primarily strategic roles, while 56 percent are in operational roles
6/29/17
Organizations continue to invest in new roles as they design the supply management organization of the future. More priority is being given to data analytics, supplier risk and improved integration with the business.
5/11/17
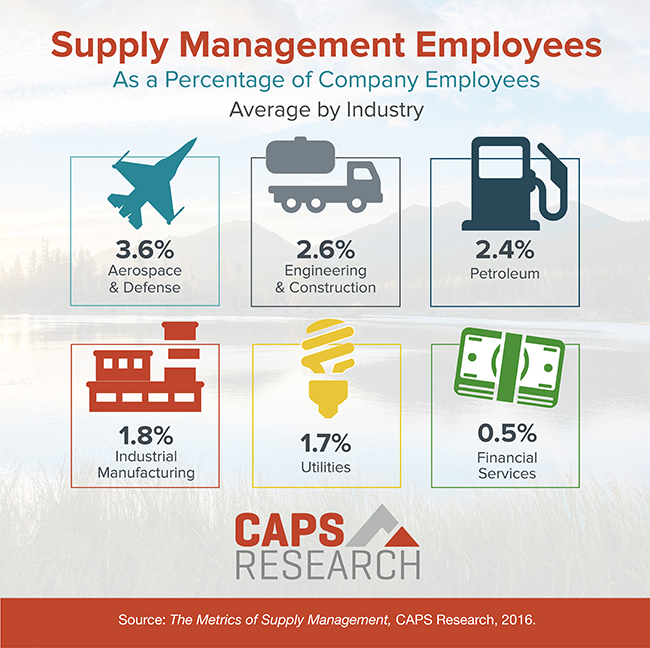
The strategic role of the supply management group is growing, but at many companies, existing head-count levels and resources are unchanged. Supply management personnel as a percentage of all company employees (regardless of industry) is holding steady — 1.8 percent in 2016, 1.9 percent in 2015 and 1.7 percent in 2014.
4/27/17
The strategic role of the supply management group is growing, but at many companies, existing head-count levels and resources are unchanged. Supply management personnel as a percentage of all company employees (regardless of industry) is holding steady — 1.8 percent in 2016, 1.9 percent in 2015 and 1.7 percent in 2014.
4/6/17
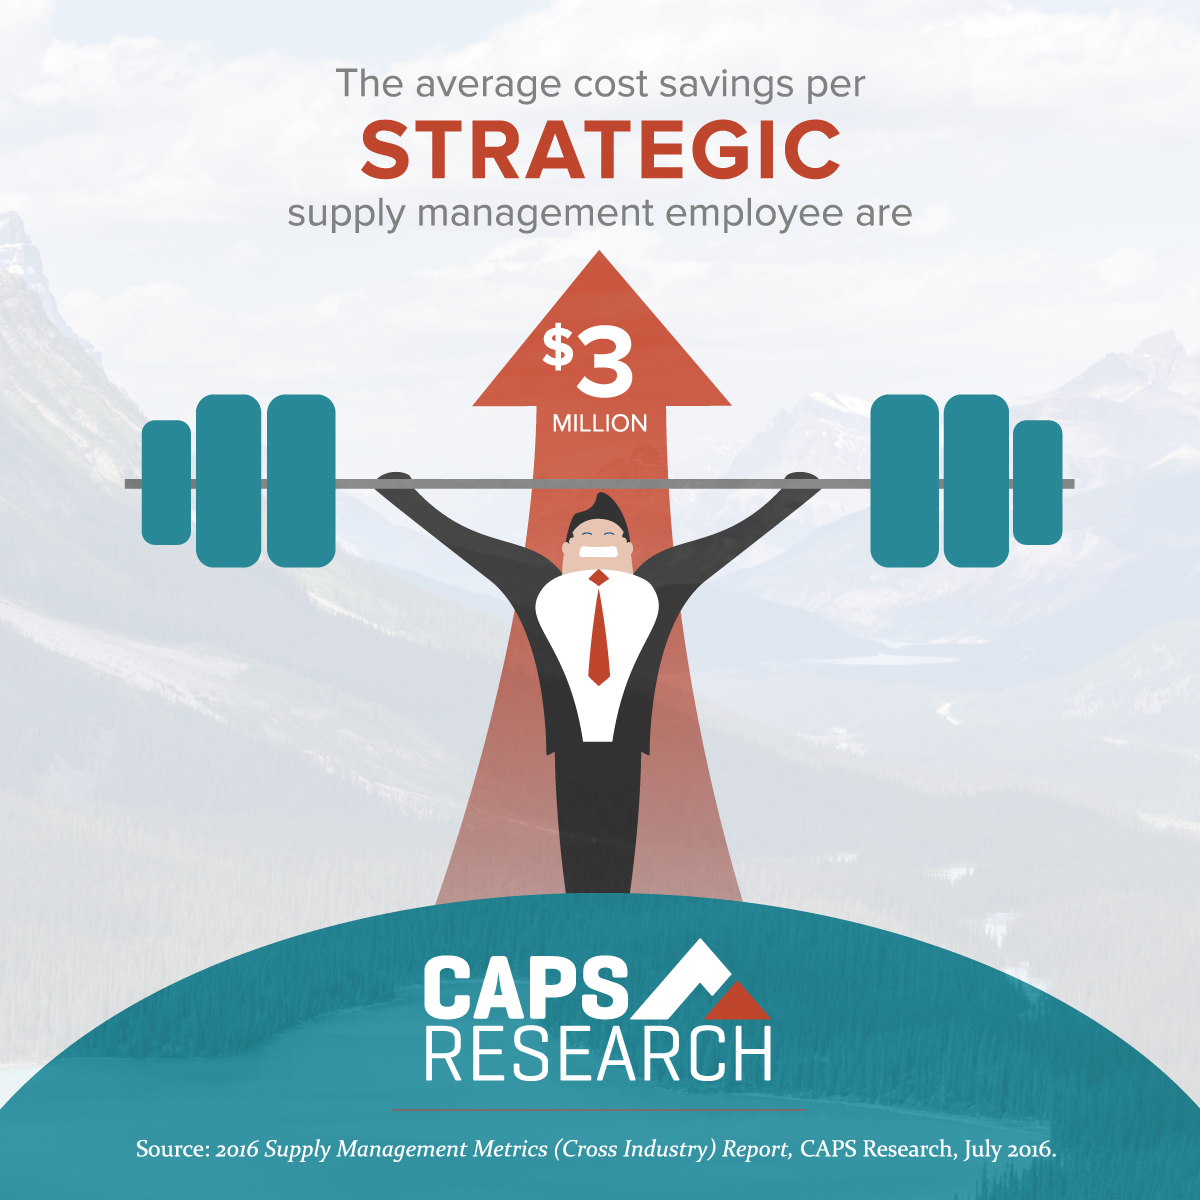
Of all the KPIs that show the value of the supply management group, cost savings is most vital. The cost savings generated by your strategic supply management employees makes them extremely valuable to your organization. How much total cost savings (reduction and avoidance) are your strategic supply management employees delivering?
Create a free CAPS Library account
A world of information at your fingertips
Browse our timely benchmarking metrics and thought-provoking research with a free CAPS Library account.

Non-members can receive the report of each survey they submit.
Members can access all reports, but are encouraged to submit surveys to
increase the comparative breakouts only they receive.